Books from SpaceMath
INSIGHT Mission: Exploring Mars
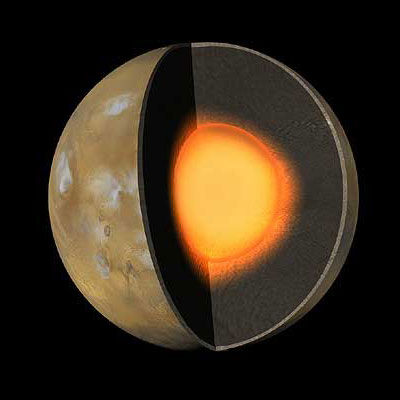
Scientists are exploring the surface and interior of Mars in order to understand how it was formed and has evolved over billions of years. This will help us understand the basic properties, formation and evolution of all four 'terrestrial' planets in our solar system. These modules explore aspects of the properties of Mars now being investigated using orbiting spacecraft, rovers and landers. [Enter here]
Juno: Exploring Jupiter
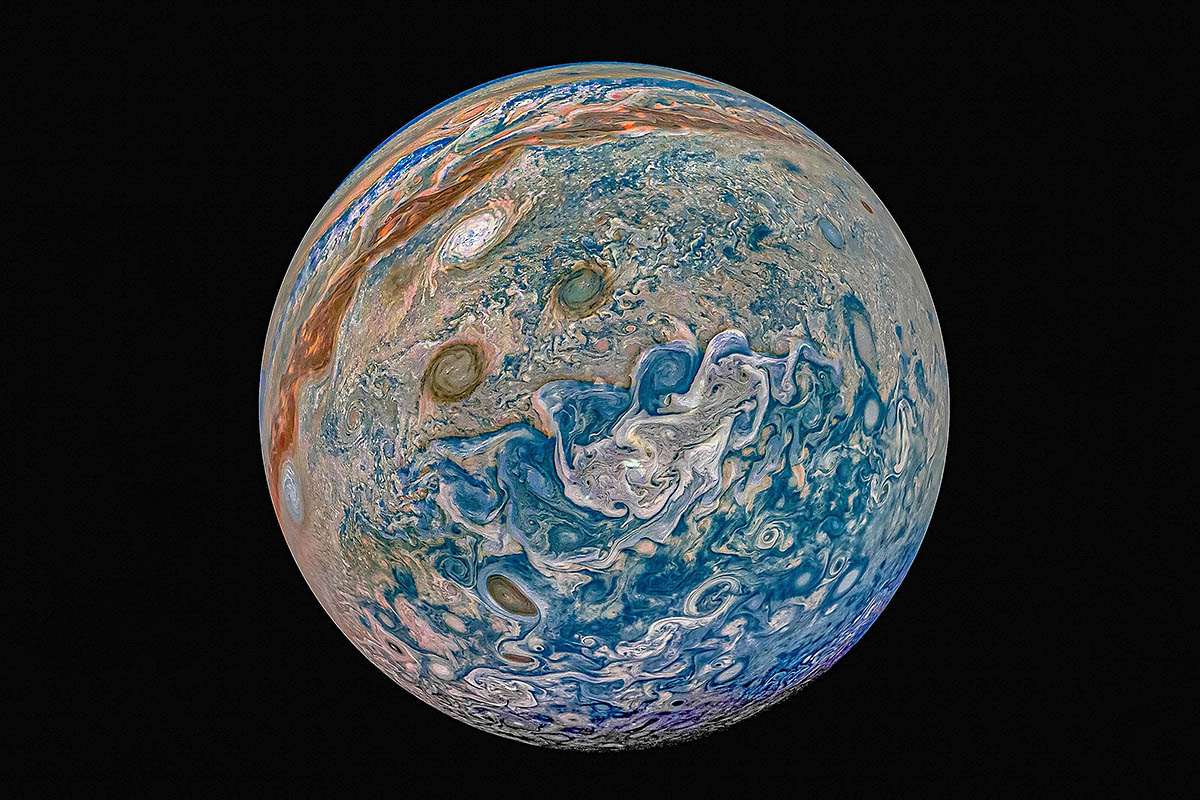
In 2016 the Juno spacecraft arrived at Jupiter and from its polar orbit took many dramatic images of the jovian north and south polar regions. [Enter here]
New Horizons: Exploring Pluto
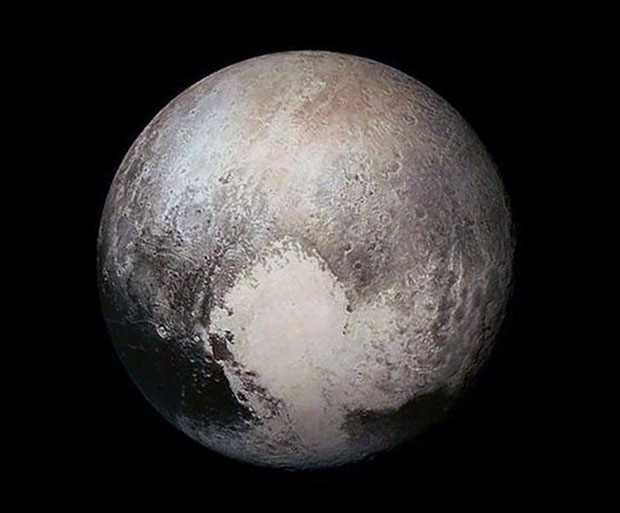
In 2015 the New Horizons mission arrived at Pluto and during its week-long flyby it captured numerous high-resolution images of this dwarf planet. For the first time in human history we could finally see what this remote object looked like, revealing an object full of surprizes! [Enter here]
Exploring Climate Change
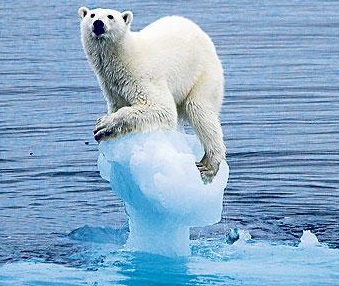
Changes in Earth's climate are beginning to produce a number of challenges to the current ways in which humans live and operate on the surface of Earth. This module explores the discovery of these changes through actual data on global warming, sea level rise, and other measurable factors defining the current climate system.[Enter here]
The Parker Solar Probe
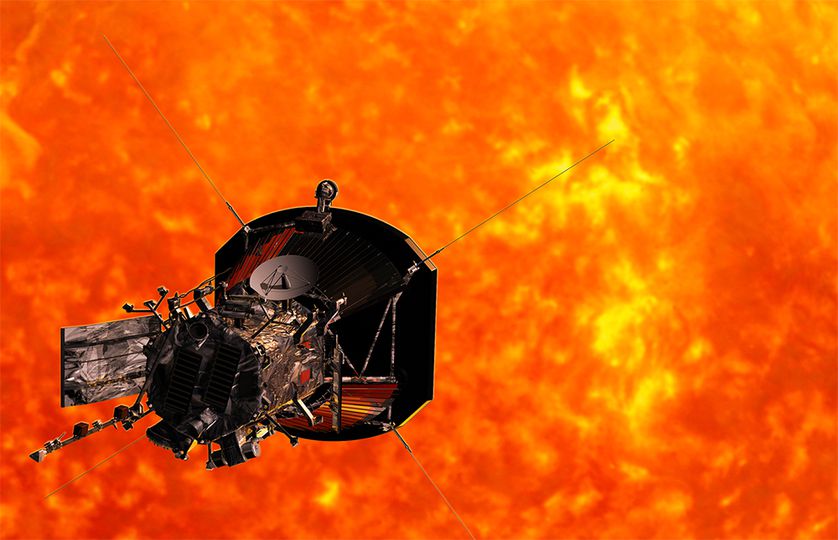
Between July 30 and August 19, 2018, the Parker Solar Probe will be launched for an encounter with the sun's corona. Here are a few resources you can download from the embedded link that feature this historic event!
- The PSP Heat Shield - To prevent its delicate scientific instruments from over-heating, the entire spacecraft will hide behind a heat shield
- Exploring the Pressure of Sunlight - The spacecraft will reach a distance of only 7 million kilometers from the sun, where the sunlight pressure is 0.0047 Newtons per square meter. This pressure of sunlight has to be accounted for in order to predict an accurate orbit for the spacecraft near the sun!
- Exploring Fractions Using Mass Limits - When engineers design a spacecraft, they have to follow strict mass limits so that the total mass of the spacecraft isnt more than the rocket can carry into orbit.
- Exploring Orbital Speeds - The spacecraft will be placed in a series of elliptical orbits around the sun. As the spacecraft travels around the elliptical path, its speed changes from a very fast pace nearest the sun (called the perihelion), to a very slow speed at its farthest point (called the aphelion).
- Exploring Linear Equations - The spacecraft consists of 11 separate systems and the fuel for the thrusters. All of these systems have to work together to create a functioning spacecraft that can conduct scientific research.
- Exploring Solar Energy - NASAs mission to the sun will be powered by two different solar panel systems. The first system will operate when the spacecraft is between the orbit of Earth and Mercury. These panels will be retracted behind the heat shield to avoid damage. A second solar panel system will then take over and carefully poke out from behind the heat shield to generate just enough electricity to run the 480-watt spacecraft as the spacecraft travels to 9.5 million kilometers from the sun. Why do we need two systems?
- Solar Heating of the Spacecraft - Any surface in space near the sun will heat up as it absorbs solar energy. It will absorb sunlight at all wavelengths, but it can only cool off by emitting infrared radiation, which we experience as heat radiation making the body warm to the touch.
- Solar Proton Storms - Solar proton storms are intense bursts of high-energy protons created as dense clouds of plasma are ejected from the sun. The spacecraft will have a ring-side seat to observe how these events are caused.
- Investigating Elliptical Orbits - The Parker Solar Probe spacecraft will make 7 fly-bys of the planet Venus in order to arrive at its final elliptical orbit. This final orbit will have a perihelion of 7 million km, and an aphelion at the orbit of Venus located 110 million km from the sun. Spacecraft orbits are a great way to review the geometric properties of ellipses!
- The Interplanetary Dust Hazard - During the 24 solar orbits of the mission, the spacecraft will encounter a thermal environment that is 50 times more severe than any previous spacecraft. It will also travel through a dust environment previously unexplored, and be subject to particle hypervelocity impacts at speeds much faster than anything previously encountered by NASA spacecraft.
Math problems related to NASA missions
Problem 81: The Pressure of a Solar Storm -
Students will examine three mathematical models for determining how much pressure
a solar storm produces as it affects Earth's magnetic field. They will learn that magnetism produces pressure, and that
this accounts for many of the details seen in solar storms.
[Grade level: 9-11 | Topics: Substituting numbers into equations; filling out missing table entries;
data interpretation; mathematical models ] [Check here]
Problem 572: How Saturns Moon Mimas Created the Cassini Division
Students calculate the acceleration of gravity in Cassinis Division and estimate the number of years to eject these particles.
[Grade: 9-12 | Topics: scientific notation; evaluating a formula for gravity; unit conversions]
[Check here]
Problem 569: Orbit Speeds and Times for Saturns Rings
Students learn about the orbit speeds of ring particles and how orbit periods in the Cassini Division relate to the orbit of the moon Mimas.
[Grade: 6-8 | Topics: square root formulae; circumference of circle; speed = distance/time ]
[Check here]
Problem 552:Cassini Sees Earth From Space - How Bright is it?
Students explore the logarithmic magnitude scale and estimate how bright Earth appears from Saturn as viewed in a recent Cassini image
[Grade: 9-12 | Topics: logarithms; power laws ]
[Check here]
Problem 549:Saturns Rings- Shadows from Moons and Ringlets
Students use an image of a ring of Saturn to investigate its thickness using shadows cast by ringlet material kicked up by a passing moon.
[Grade: 6-8| Topics: scales; proportions; triangle geometry; angle measurement]
[Check here]
Problem 548:Saturns Rings - A close-up study
Students use a Cassini image of Saturns rings to calculate the sizes of the smallest rings, and how their thicknesses change with distance from Saturn.
[Grade: 3-5 | Topics: measurement; scales; proportions; metric measure; bar graphs]
[Check here]
Problem 547:The Rings of Saturn
Students explore the volume and mass of the rings of saturn to estimate the number of ring particles and their separations, and the radius of the equivalent spherical body.
[Grade: 9-12 | Topics: volume of a ring and a sphere; scientific notation]
[Check here]
Problem 461: Cassini Delivers Holiday Treats from Saturn
Students explore proportions and angular size using images of Saturn's moons Titan and Dione
[Grade: 7-9 | Topics: scale models; proportions]
[Check here]
Problem 335: Methane Lakes on Titan
Students use a recent Cassini radar image of the surface of Titan to estimate how much methane is present in the lakes that fill
the image, and compare the volume to that of the fresh water lake, Lake Tahoe.
[Grade: 6-8 | Topics: estimating irregular areas; calculating volume from area x height; scaled images ]
[Check here]
Problem 315: The Mysterious Hexagon on Saturn
A curious hexagon formed by the Saturn polar jet stream, and photographed by the Cassini spacecraft, is
used to determine wind speed and acceleration.
[Grade: 6-9 | Topics: Measuring; Metric Units; speed=distance/time]
[Check here]
Problem 154: Pan's Highway and Saturn's Rings
Students use an image from the Cassini spacecraft to
determine how large the satellite Pan is, and the
scale of Saturn's rings using a millimeter ruler.
[Grade: 4-6 | Topics:Finding the scale of an image; measurement; unit conversion]
[Check here]
Problem 135: How Big is It? - Io and Jupiter.
Students work with an image taken by the Cassini spacecraft of Jupiter and its satellite Io.
They determine the image scale, and calculate the sizes of various features in the image.
[Grade: 4 - 7 | Topics:image scaling; multiply, divide, work with millimeter ruler]
[Check here]
Problem 680:A Pulsar Shot Out from a Supernova Explosion!
Students study the speed of a pulsar ejected from a supernova explosion, and describe what would happen if the dense star collided with a star like the sun.
[Grade: 6-8 | Topics: Scientific notation; speed=distance/time; unit conversions; density ]
[Check here]
Problem 511: Giant Gas Cloud in System NGC 6240
Students use scientific notation and volume of sphere to estimate the density of the gas cloud,
and the number of hydrogen atoms per cubic meter.
[Grade: 8-10 | Topics:Volume of a sphere; scientific notation; unit conversion ]
[Check here]
Problem 439: Chandra Sees a Distant Planet Evaporating
The planet CoRot2b is losing mass at a rate of 5 million tons per second. Students estimate how long it will
take for the planet to lose its atmosphere
[Grade: 6-8 | Topics: Scientific Notation; RAte = Amount/Time]
[Check here]
Problem 417: Estimating the Size and Mass of a Black Hole
Students use a simple formula to estimate the size of a black hole located 3.8 billion light years from Earth, recently studied by NASA's Chandra and Swift satellites.
[Grade: 8-10 | Topics: distance=speed x time]
[Check here]
Problem 398: The Crab Nebula - Exploring a pulsar up close!
Students work with a photograph to determine its scale and the time taken by light and matter to reach a specified distance.
[Grade: 6-8 | Topics: Scale drawings; unit conversion; distance = speed x time]
[Check here]
Problem 390: X-rays from hot gases near the black hole SN1979c
Students use two functions to estimate the size of a black hole from the gas emitting x-rays which is flowing into it.
[Grade: 8-10 | Topics: Functions; substitution; evaluation]
[Check here]
Problem 389: Estimating the diameter of the SN1979c black hole
Students use simple equations to learn about the various definitions for the sizes of black holes in terms of their event horizons, last photon orbit, and last stable particle orbit radii, and apply this to the recently discovered 'baby' black hole in the galaxy M-100
[Grade: 6-8 | Topics: evaluating linear functions; integer math; metric units]
[Check here]
Problem 314: Chandra Studies an Expanding Supernova Shell
Using a millimeter ruler and a sequence of images of a gaseous shell between 2000 and 2005,
students calculate the speed of the material ejected by Supernova 1987A.
[Grade: 6-9 | Topics: Measuring; Metric Units; speed=distance/time]
[Check here]
Problem 289: Chandra Spies the Longest Sound Wave in the Universe
Students use an image of sound waves produced by a massive black hole to determine wavelength, and comparisons with
musical scale to find how many octaves this sound wave is below the wavelength of middle-C.
[Grade: 6-8 | Topics: metric measurement; scaling; Scientific Notation; exponents]
[Check here]
Problem 285: Chandra Sees the Most Distant Cluster in the Universe
Students work with kinetic energy and escape velocity to determine the mass of a distant cluster of galaxies by using information
about its x-ray light emissions.
[Grade: 9-12 | Topics: Algebra I; Solving for X; Scientific notation]
[Check here]
Problem 283: Chandra Observatory Sees the Atmosphere of a Neutron Star
Students determine the mass of the carbon atmosphere of the neutron star Cas-A.
[Grade: 8-10 | Topics: Volume of spherical shell; mass = density x volume]
[Check here]
Problem 234: The Hand of Chandra
Students use an image from the Chandra Observatory to measure a pulsar ejecting a cloud of gas.
[Grade: 6-8 | Topics: Scientific Notation; proportions; angle measure]
[Check here]
Problem 144: Exploring Angular Size
Students examine the concept of angular size and how it relates to the physical size of
an object and its distance. A Chandra Satellite x-ray image of the star cluster NGC-6266 is used, along with its distance, to
determine how far apart the stars are based on their angular separations.
[Grade: 7 - 10 | Topics:Scientific Notation; degree measurement; physical size=distance x angular size.]
[Check here]
Problem 434: Dawn Spacecraft Sees Asteroid Vesta Up-Close!
Students use an image of the asteroid to determine the diameters of craters
and mountains using a millimeter ruler and the scale of the image in meters per millimeter.
[Grade: 6-8 | Topics: scale, metric measurement]
[Check here]
Problem 210: The Mathematics of Ion Rocket Engines
Students learn about the basic physics of ion engines, calculating speeds.
[Grade: 9-12| Topics: Scientific Notation; Algebra II; evaluating formulae.]
[Check here]
Problem 202: The Dawn Mission - Ion Rockets and Spiral Orbits
Students determine the shape of the trajectory taken by a spacecraft using a constant-thrust ion motor using differential and integral calculus for arc lengths.
[Grade: 9-12| Topics: Calculus - Arc lengths.]
[Check here]
Problem 387: A Mathematical Model of Water Loss from Comet Tempel-1
Students use data from the Deep Impact spacecraft to create a simple empirical model for predicting the rate of water loss from a comet based on actual data.
[Grade: 8-10 | Topics: graphing; fitting a parabola to data; evaluating functions]
[Check here]
Problem 383: Estimating the mass of Comet Hartley 2 using calculus.
Students use a recent image of the nucleus of Comet Hartley 2 taken by the Deep Impact/EPOXI camera and a shape function described
by a fourth-order polynomial to calculate the volume of the comet's head using integral calculus.
to estimate the volume of the comets nucleus, and its total mass,
[Grade: 12 | Topics: Volume integral using disk method; scale model; scientific notation; unit conversion]
[Check here]
Problem 382: Estimating the mass and volume of Comet Hartley 2.
Students use a recent image of the nucleus of Comet Hartley 2 taken by the Deep Impact/EPOXI camera and a simple geometric 'dumbell'
model based on a cylinder and two spheres, to estimate the volume of the comets nucleus, and its total mass.
[Grade: 8-10 | Topics: volume of a sphere and cylinder; scale model; scientific notation; unit conversion]
[Check here]
Problem 374: Deep Impact - Closing In on Comet 103P/Hartley 2
Students use the Tangent formula to figure out the angular size of the comet at closest approach, and the scale of the HRI camera image.
[Grade: 8-10 | Topics: Scaled images; trigonometry; angle measure]
[Check here]
Problem 324: Deep Impact Comet Flyby
The Deep Impact spacecraft flew by the Comet Tempel-1 in 2005. Students determine
the form of a function that predicts the changing apparent size of the comet as viewed from the spacecraft
along its trajectory.
[Grade: 9-12 | Topics: Algebra, geometry, differential calculus]
[Check here]
Problem 277: Deep Impact Comet Encounter
Students learn about the Deep Impact experiment involving Comet Tempel-1, and how the path of an asteroid can be changed by using
the Law of Conservation of Momentum.
[Grade: 10-12 | Topics: Algebra; Scientific Notation; distance = speedxtime]
[Check here]
Problem 275: Water on the Moon!
Students estimate the amount of water on the moon using data from Deep Impact/EPOXI and NASA's Moon Minerology Mapper experiment on the Chandrayaan-1 spacecraft.
[Grade: 8-10 | Topics: Geometry, Spherical volumes and surface areas, Scientific notation]
[Check here]
Problem 255: Tempel-1 - Closeup of a Comet
Students examine an image of the Comet Tempel-1 taken by the Deep Impact spacecraft to determine feature sizes and other details.
[Grade: 6-8 | Topics: scales, proportions ]
[Check here]
Problem 513: The Remarkable Gamma Ray Burst GRB 130427A
Students work with the surface area of a sphere, metric conversions and scientific
notation to calculate the total power of this distant supernova event.
[Grade: 8-10 | Topics: surface area of sphere; scientific notation]
[Check here]
Problem 503: The Origin of Cosmic Rays
Students explore the Fermi Gamma-Ray Observatory's confirmation of the idea that supernova are the sources of cosmic rays in the Milky Way. They use a simple model to estimate how many supernova are needed to account for the current number of cosmic rays in the galaxy.
[Grade: 8-10 | Topics: percercentages, scientific notation; volume of a disk]
[Check here]
Problem 460: Fermi Explores the High-Energy Universe
Students work with percentages to explore the identities of the 1873 gamma-ray sources detected by NASAs Fermi Observatory
[Grade: 6-8 | Topics: percentages; pie graphs]
[Check here]
Problem 330: Fermi Detects Gamma-rays from the Galaxy Messier-82
Based on a recent press release, students work with a log-log plot to show that straight lines on this plot represent power-law functions.
They use this fact to determine, by interpolation, the strength of the gamma-rays from this galaxy.
[Grade: 10-12 | Topics: power-laws; log-log graphing; linear regression]
[Check here]
Problem 288: Fermi Observatory Measures the Lumps in Space
Students use timing data obtained by the Fermi Observatory of a powerful gamma-ray burst 10 billion light years away,
to determine how
lumpy space is based on travel time delays between the lowest and highest-energy gamma-rays.
[Grade: 9-12 | Topics: Scientific Notation; Evaluating an equation with multiple factors]
[Check here]
Problem 111: A Star Sheds a Comet Tail!
The GALEX satellite captured a spectacular image of the star Mira shedding a tail of gas and dust nearly
13 light years long. Students use the GALEX image to determine the speed of the star, and
to translate the tail structures into a timeline extending to 30,000 years ago.
[Grade: 8-10 | Topics:Image scaling; Unit conversion; Calculating speed from distance and time]
[Check here]
Problem 509:Gail Spacecraft Creates a New Crater on the Moon
Students work with images of the Grail impact sites to estimate the diameter of the crater created
after the spacecraft impacted the moon.
[Grade: 6-8 | Topics: scale and proportion; volume of cylinder; mass=DensityxVolume]
[Check here]
Problem 504: Grail Satellites Create a Gravity Map of the Moon
Students explore the gravity field of the moon, and the behavior of simple pendulum clocks in places on the moon where the local gravity is slightly different.
[Grade: 9-12 | Topics: square-roots; evaluating equations]
[Check here]
Problem 478: The Grail and LRO Encounter in Lunar Orbit
Students explore the May 31, 2012 encounter between NASA's Grail and LRO spacecraft in orbit around the moon. Will the Grail/Ebb spacecraft be able to photograph the LRO spacecraft as it passes-by?
[Grade: 9-12 | Topics: formula for an ellipse; semi-major and minor axis]
[Check here]
Jump to Top of Page
Problem 421: The Lense-Thirring Effect Near the Sun and a Neutron Star
Students work with a formula for the Lense-Thirring Effect and estimate how large it will be in orbit around our sun, and in the intense gravitational field of a dense neutron star.
[Grade: 9-12 | Topics: algebra; scientific notation, angular measure]
[Check here]
Problem 420: Gravity Probe B: Testing Einstein again!
Students learn about the Lense-Thirring Effect, and calculate its magnitude near Earth's orbit using an algebraic equation with integer and fractional exponents.
[Grade: 9-12 | Topics: algebra; scientific notation, angular measure]
[Check here]
Jump to Top of Page
Problem 362: Hinode Discovers the Origin of White Light Flares
A study of the magnetic energy of a flare[Grade: 9-12 | Topics: Image scale; Algebra; Scientific Notation]
[Check here]
Problem 105: The Transit of Mercury
As seen from Earth, the planet Mercury occasionally passes
across the face of the sun; an event that astronomers call a transit. From images taken by the
Hinode satellite, students will create a model of the solar disk to the same scale as the
image, and calculate the distance to the sun.
[Grade: 9-11 | Topics:image scales; angular measure; degrees, minutes and seconds]
[Check here]
Problem 104: Loopy Sunspots!
Students will analyze data from the Hinode satellite to determine the volume and mass of a
magnetic loop above a sunspot. From the calculated volume, based on the formula for the volume of a cylinder, they will use the density of the plasma determined by
the Hinode satellite to determine the mass in tons of the magnetically trapped material.
[Grade: 9-11 | Topics:image scales; cylinder volume
calculation; scientific notation; unit conversions]
[Check here]
[Check here]
Problem 103: The Mysterious Solar Micro-Flares!
Students will analyze an image taken by the Hinode
solar satellite to determine the scale of the image in kilometers per millimeter,
then use this to determine the sizes of solar micro-flares.
From the number of micro-flares that they count in the image,
the area of the image in square kilometers, and the surface area
of a spherical sun, they will calculate the total number
of micro-flares on the solar surface.
[Grade: 6-9 | Topics:image scales; area calculation; unit conversions]
Problem 102: How fast does the sun rotate?
Students will analyze consecutive images taken by the Hinode satellite to determine the sun's speed of rotation, and the approximate length of its 'day'.
[Grade: 6-9 | Topics:image scales; time calculations; speed calculations, unit conversions]
[Check here]
Problem 99: The Hinode Satellite Views the Sun
Students will use a full-sun image from the new Hinode satellite
to sketch the locations of magnetic fields on the sun's surface using information in the introductory article as a guide.
[Grade level: 6-8 | Topics:image interpretation; eye-hand coordination; reading to be informed]
[Check here]
Problem 97: Hinode - Closeup of a Sunspot
Students will determine the sizes of sunspots and solar granulation cells from a recent image
taken by the Hinode solar observatory.
[Grade level: 6-8 | Topics:image scales, metric units, unit conversion]
[Check here]
Problem 96: Hinode Satellite Power
Students will study the design of the Hinode solar satellite and calculate how much power it can generate from its solar panels.
[Grade level: 6-8 | Topics:area of rectangle,area of cylinder, unit conversion]
[Check here]
Problem 85: The Solar Tsunami!
Recent data from the Hinode satellite is used
to measure the speed of a solar explosion on the surface of the sun using a
series of images taken by the satellite at three different times.
Students calculate the speed of the blast between the first pair and last pair of images, and determine if the
blast wave was accelerating or decellerating in time.
[Grade level: 5-8 | Topics: Finding image scale; calculating time differences; calculating speed from distance and time]
[Check here]
Problem 669: Exploring Two Nearby Stars to the Sun.
Students explore two nearby stars Ross 128 and Gliese 445 and determine when they will be the nearest stars to our sun by working with quadratic equations that model their distances.
[Grade: 9-12 | Topics: Working with quadratic equations; intersection points of quadratic functions]
[Check here]
Problem 664: HST - The Sun's Nearest Companions - At least for now!
Students study a graph that models the distances from the sun of seven nearby stars over a 100,000 year time span. They determine the minimum distances and a timeline of which star will be the suns new closest neighbor in space in the next 80,000 years.
[Grade: 6-8 | Topics: Graphical data; finding minimum from a plotted curve]
[Check here]
Problem 663: HST - The Hubble Search for the Farthest Galaxy in the Universe
Students learn about the recent discovery of z8_GND_5296 what may be the farthest known galaxy in our visible universe whose light left the galaxy
when the universe was only 700 million years old. They use a simple linear equation to estimate the galaxy's
look-back time, and learn about the cosmological redshift.
[Grade: 6-8 | Topics: working with simple equations; solving for X]
[Check here]
Problem 501: Exploring the Most Distant Galaxies with Hubble
Students use recent Hubble Extreme Deep Field data and a polynomial to determine the light travel time between distant galaxies and Earth.
[Grade: 11-12 | Topics: polynomials; linearization]
[Check here]
Problem 490: LL Pegasi - A Perfect Spiral in Space
The star LL Persei is ejecting gas like a sprinkler on a lawn. Every 800 years the gas makes one complete
orbit, and over time forms a spiral pattern in space. Students explore the timing of this pattern and estimate the size and age of this gas.
[Grade: 6-8 | Topics: Distance = speed x time; unit conversions; evaluating formulas ]
[Check here]
Problem 487: The Hubble eXtreme Deep Field
Students use the Hubble XDF to estimate the number of galaxies in the visible universe.
[Grade: 6-8 | Topics: Counting, areas, proportions ]
[Check here]
Problem 481: Pluto's Fifth Moon
Students explore Kepler's Third Law and estimate the orbit period of a hypothetical sixth moon using the distance:period law.
They also determine the mass of Pluto using the orbit data, including the recently discovered fifth moon (P5) of Pluto by the Hubble Space Telescope.
[Grade: 9-12 | Topics: Power functions; integer exponents; Scientific Notation; tabular data]
[Check here]
Problem 480: The Expanding Gas Shell of U Camelopardalis
Students explore the expanding U Camelopardalis gas shell imaged by the Hubble Space Telescope, to determine its age and the density of its gas.
[Grade: 6-8 | Topics: Scientific Notation; distance = speed x time; density=mass/volume ]
[Check here]
Problem 399: A Galactic City in the Far Reaches of the Universe
Students work with an image of a distant cluster of galaxies to determine its scale compared to nearby galaxies.
[Grade: 6-8 | Topics: Scale; proportion; metric measurement; unit conversion]
[Check here]
Problem 395: Death Stars
Some stars create super-flares that are capable of eliminating life on planets that orbit close to the star. Students learn about
these flares on common red-dwarf stars and compare them to flares on our own sun
[Grade: 6-9 | Topics: Scientific Notation; percentages; rates of change]
[Check here]
Problem 388: Hubble Detects More Dark Matter
Students learn about how astronomers estimate the amount of invisible dark matter in a cluster of galaxies by comparing its visible mass against the speeds of the galaxies to 'weigh' the cluster'
[Grade: 8-10 | Topics: evaluating functions; Scientific notation]
[Check here]
Problem 364: The Cometary Planet HD209458b
Astronomers using NASA's Hubble Space Telescope have confirmed that this gas giant
planet is orbiting so close to its star its heated atmosphere is escaping into space.
[Grade: 9-12 | Topics: Scientific Notation; volume of a sphere; density; rates]
[Check here]
Problem 363: Celestial Fireworks Near NGC3603
This young star cluster, barely one million years old, is furiously evaporating the clouds
of interstellar gas and dust from which it formed.
[Grade: 9-12 | Topics: Scientific Notation; evaluating functions; density]
[Check here]
Problem 344: Hubble Spies an Asteroid - Yes it does move!
The track of an asteroid in a Hubble image of a cluster of galaxies is analyzed to determine speed of the asteroid.[Grade: 6-8 | Topics: Scaling; unit conversion; speed=distance/time]
[Check here]
Problem 333: Hubble: Seeing a Dwarf Planet Clearly
Based on a recent press release, students use the published photos to determine the sizes of the smallest discernible features and compare them to the sizes of the 48-states in the USA.
They also estimate the density of Pluto and compare this to densities of familiar substances to create a 'model' of Pluto's composition.
A supplementary Inquiry Problem asks students to model the interior in terms of two
components and estimate what fraction of Pluto is composed of rock or ice.
[Grade: 8-12 | Topics: scales and ratios; volume of sphere; density=mass/volume]
[Check here]
Problem 332: Hubble: The Changing Atmosphere of Pluto
Based on a recent press release, students determine the aphelion and perihelion of Pluto's elliptical orbit using the properties of ellipses, then
calculate the temperature of Pluto at these distances to estimate the thickness of Pluto's atmosphere and its changes during its orbit around the sun.
[Grade: 10-12 | Topics: properties of ellipses; evaluating an algebraic function ]
[Check here]
Problem 329: WISE and Hubble: Power Functions: A question of magnitude
Students explore the function F(x) = 10^-ax and learn about the stellar magnitude scale used by astronomers to rank the brightness of stars.
[Grade: 10-12 | Topics: base-10, evaluating power functions ]
[Check here]
Problem 326: Hubble Spies Colliding Asteroids
Based on a recent press release, students calculate how often asteroids collide in the Asteroid belt using a simple formula. Students
estimate belt volume, and asteroid speeds to determine the number of years between collisions. They also investigate how
the collision time depends on the particular assumptions they made. An 'extra' integration problem is also provided for calculus students.
[Grade: 8-12 | Topics: Volume of a thin disk; Algebra 1; Evaluating a definite integral; power-law]
[Check here]
Problem 316: Counting Craters on the Hubble Space Telescope
Students count craters on a piece of the Wide Field Planetary
Camera recovered from the Hubble Space Telescope in 2009. They determine the cratering rate and use this to predict
how many impacts the solar panels on the International Space Station experiences each day.
[Grade: 6-9 | Topics: Counting; Area; density]
[Check here]
Problem 295: Details from an Exploding Star
Students work with an image from the Hubble Space Telescope of the Crab Nebula to calculate scales and sizes of various features.
[Grade: 6-9 | Topics: Scale; measurement; metric units]
[Check here]
Problem 240: The Eagle Nebula Close-up
Students measure a Hubble image of the famous Eagle Nebula 'Pillars of Creation' to determine the sizes of
various features compared to our solar system
[Grade: 8-10 | Topics: scale, proportion, angle measure]
[Check here]
Problem 239: Counting Galaxies with the Hubble Space Telescope
Students use an image of a small area of the sky to estimate the total number of galaxies in the universe visible from Earth.
[Grade: 8-10 | Topics: area, angular measure]
[Check here]
Problem 238: Satellite Drag and the Hubble Space Telescope
Satellite experience drag with the atmosphere, which eventually causes them to burn up in the atmosphere. Students study
various forecasts of the altitude of the Hubble Space Telescope to estimate its re-entry year.
[Grade: 8-10 | Topics: interpreting graphical data; predicting trends]
[Check here]
Problem 197: Hubble Sees a Distant Planet
Students study an image of the dust disk around the star Fomalhaunt and determine the orbit period and distance of a newly-discovered planet orbiting this young star.
[Grade: 6-10| Topics: Calculating image scales; Circle circumferences; Unit conversions; distance-speed-time]
[Check here]
Problem 122: XZ Tauri's Super CME!
Ordinarily, the SOHO satellite and NASA's STEREO mission spot coronal
mass ejections (CMEs) but the Hubble Space Telescope has also spotted a few of its own...on distant stars! Students will
examine a sequence of images of the young star XZ Tauri, and measure the average
speed and density of this star's CME event between 1955 and 2000.
[Grade: 8-10 | Topics:Calculate image scale; speed
from distance and time; mass:volume:density]
[Check here]
Problem 49: A Spiral Galaxy Up Close.
Astronomers can learn a lot from studying photographs of galaxies. In
this activity, students will compute the image scale (light years per millimeter) in a
photograph of a nearby spiral galaxy, and explore the sizes of the features found in the image. They
will also use the internet or other resources to fill-in the missing background information about this galaxy.
[Grade level: 6-8 | Topics: Online research; Finding the scale of an image; metric measurement; decimal math]
[Check here]
Jump to Top of Page
Problem 274: IBEX Uses Fast-moving Particles to Map the Sky!
Students learn about kinetic energy and how particle energies and speeds are related to each other in a simple formula,
which they use to derive the speed of the particles detected by the IBEX satellite.
[Grade: 8-10 | Topics: Algebra I, Scientific notation]
[Check here]
Problem 273: IBEX Creates an Unusual Image of the Sky
Students create an image of the sky by using a Bingo-like technique of tallying particles in
various sky directions using a simple 5x5 grid.
[Grade: 6-8 | Topics: Counting, tallying]
[Check here]
Problem 114: The Heliopause...a question of balance
Students will learn about the concept of pressure equilibrium
by studying a simple mathematical model
for the sun's heliopause located beyond the orbit of Pluto. They will calculate the distance to the
heliopause by solving for 'R' and then using an Excel spreadsheet
to examine how changes in solar wind density, speed and interstellar gas density relate to
the values for R.
[Grade: 8-10 | Topics: Formulas with two variables; scientific notation; spreadsheet programming]
[Check here]
Problem 41: Solar Energy in Space
Students will calculate the area of a satellite's surface
being used for solar cells from an actual photo of the IMAGE satellite.
They will calculate the electrical power provided by this one panel. Students
will have to calculate the area of an irregular region using nested rectangles.
[Grade level: 7-10 | Topics: Area of an irregular polygon; decimal math]
[Check here]
Problem 35: Exploring the Plasmasphere
Students use an image of the plasmasphere obtained
by the IMAGE satellite to calculate how fast it orbits the Earth. They
will use this to determine whether gravity or Earth's magnetic field
provides the forces responsible for its movement through space.
[Grade: 7 - 9 | Topics: Geometry; ratios; decimal math; time arithmetic]
[Check here]
Problem 25: The Distance to Earth's Magnetopause
Students use an algebraic formula and some real
data, to calculate the distance from Earth to the magnetopause, where
solar wind and magnetosphere pressure are in balance.
[Grade: 8 - 10 | Topics: Evaluating a function with two variables; completing tabular entries]
[Check here]
Problem 22: The Auroral Oval
Students learn that the aurora are observed as two
'halos' of light encircling the North and South Poles. Students use
measurements made from two satellite images of the 'auroral ovals' to
determine the diameter of the rings, and their approximate geographic
centers - which are not at the geographic poles!
[Grade: 5 - 7 | Topics: Finding the scale of an image; measurement; decimal math]
[Check here]
Problem 21: Exploring the Plasmasphere
Students learn that the Pythagorean Theorem is more
than a geometric concept. Scientists use a photograph taken by the IMAGE
satellite to measure the size of Earth's plasmasphere region using a ruler
and protractor.
[Grade: 7 - 9 | Topics: Finding the scale of an image; decimal math; measurement]
[Check here]
Problem 15: Radio Plasma Imaging with IMAGE
Students use the Distance=VelocityxTime relationship
to determine the distances to plasma clouds seen by the IMAGE satellite.
[Grade: 6 - 8 | Topics: Polar graphs; time = distance x speed; decimal math]
[Check here]
Problem 13: Plasma Clouds >
Students use a simple 'square-root' relationship to learn how scientists
with the IMAGE satellite measure the density of clouds of plasma in space.
[Grade: 7 - 9 | Topics: Square-root; solving for X; evaluating a function]
[Check here]
Problem 12: The Ring Current
Students use the formula for a disk to calculate the
mass of the ring current surrounding Earth.
[Grade: 7 - 9 | Topics: Volume of a disk; scientific notation; mass = density x volume]
[Check here]
Problem 536:Exploring a Possible InSight Landing Area on Mars
Students work with latitude and longitude and scaled images of mars to locate the InSight proposed
landing area, and describe the terrain of the landing area.
[Grade: 6-8 | Topics: degree measure; latitude and longitude; working with scaled images; metric measure]
[Check here]
Problem 535:Comparing the InSight Landing Area to a City Block!
Students use scaled images of a proposed InSIght landing area and a scaled image of an urban neighborhood on Earth to compare the sizes
of familiar things with the unfamiliar martian landscape.
[Grade: 6-8 | Topics: scale; proportion; metric measurement]
[Check here]
Problem 534:Exploring Marsquake Energy with the Moment Magnitude Scale
Students are introduced to the Moment Magnitude marsquake scale which gives a logarithmic index for marsquakes of differing energies. They
calculate two examples of marsquakes and meteor impacts and compare their Moment Magnitude.
[Grade: 8-10 | Topics: logarithms; scientific notation; algebra ]
[Check here]
Problem 533:Exploring Logarithms and the Richter Magnitude Scale
Students work with a logarithmic scale to estimate how much ground movement occurs for earthquakes of different strengths.
[Grade: 8-10 | Topics: logarithms; base-ten exponents]
[Check here]
Problem 532:The Distance to the Martian Horizon
Students devive a basic equation for the distance to the horizon on a spherical body using the Pythagorean Theorem
and a bit of algebra. The estimate the number of cell towers needed to cover Mars.
[Grade: 8-10 | Topics: Pythagorean Theorem, Algebra; scientific notation; areas of spheres and circles ]
[Check here]
Problem 531:Exploring the Interior of Mars with Spheres and Shells
Students use the volume properties of spheres and shells along with the
relationship mass=densityxvolume to create a model of the interior of mars.
[Grade: 8-10 | Topics: formula for volume of spheres and spherical shells; mass=densityxvolume; scientific notation ]
[Check here]
Problem 530:Exploring the Mass of Mars
Students calculate the mass of mars by using satellite data and Keplers Third Law.
[Grade: 8-10 | Topics: Algebra; scientific notation ]
[Check here]
Problem 529:Exploring Impacts and Quakes on Mars
Students work with logarithmic scales to explore the relationship between the energy of an marsquake and its logarithmic index, which is
similar to the Richter Scale used for earthquakes.
[Grade: 8-10 | Topics: Logarithmic scales; scientific notation ]
[Check here]
Problem 528:Comparing the Heat Output of Mars and Earth
Students learn about the heat flow formula and use it to explore the properties of Earth and Mars in terms of their crust composition.
[Grade: 8-10 | Topics: Algebra; temperature gradients]
[Check here]
Problem 527:Exploring Heat Flow and Insulation
Students explore how insulation works to reduce heat flow. They convert a verbal description of a formula expressed in proportions, and use it to calculate why aluminum pots heat faster than steel pots, and how we can determine the
properties of martian sooil from heat flow and temperature changes.
[Grade: 8-10 | Topics: algebra; rates of change ]
[Check here]
Problem 526:Exploring Temperature Change in Earth?s Outer Crust
Students explore the rate of temperature change in the crust of Earth and Mars and learn about units expressed as degrees C/km. They calculate how hot the ground will be at various depths, and how
gold miners must deal with extreme heat.
[Grade: 6-8 | Topics: fahrenheit and celsius degrees; rates of change]
[Check here]
Problem 525:Exploring the InSight Lander Telemetry Data Flow
Students explore how long it takes to transmit digital data using examples from downloading songs from their computer to their ipod.
[Grade: 6-8 | Topics: working with kilo, mega and rates of data transfer in bytes/sec. ]
[Check here]
Problem 524:Seeing the Martian Surface with IDC
Students learn about the IDC camera and calculate resolution and how many images are needed to map the InSight landing area.
[Grade: 6-8 | Topics: ANgular measurfe, degrees and seconds; image scal; tiling an area with overlap. ]
[Check here]
Problem 523:Telling Time on Mars - Earth Days and Mars Sols
Students work with two clocks on Earth and Mars and learn about earth and mars time given that a day on Mars is 40 minutes longer than an Earth day.
[Grade: 6-8 | Topics: time calculations, hours, minutes, seconds; length of day ]
[Check here]
Problem 522:Radio Communications with Earth ? The Earth-Sun Angle
The earth-sun angle is given in tabular form in degrees. Students graph the data and find the dates when transmissions to Earth cannot occur.
[Grade: 8-10 | Topics: Interpreting tabular data; rates and slopes ]
[Check here]
Problem 521:Estimating the Mass of a Martian Dust Devil!
Students estimate the mass of a martian dust devil using the approximation that it is a cylinder with a fixed
density of dust. [Grade: 8-10 | Topics: Volume of a cylinder; mass = density x volume ]
[Check here]
Problem 520:The Work Area In Front of the Lander
Students estimate the area in front of the InSight lander where experiments will be conducted and
instruments moved with a single robotic arm. [Grade: 6-8 | Topics: Area of a circle segment; Area
common to two intersecting circles]
[Check here]
Problem 519:Scheduling Events in Time for Launch
Students learn about scheduling many events along a timeline (breakfast, packing, driving, etc )
by planning a family trip where the family members have to arrive at the airport for a flight that
leaves at a specific date and time. [Grade: 5-7 | Topics: working with time units; creating a timeline]
[Check here]
Problem 518:The InSight Seismographic Station Solar Power System
Students explore the properties of decagons to determine the area of the solar panels used on the
InSight lander. [Grade: 7-9 | Topics: area of regular polygons; estimating areas of non-square shapes]
[Check here]
Problem 508: The InSight Seismographic Station - Wave arrival times
Students work with the circumference of Mars and the speed of shock waves in the martian crust to estimate the arrival times of the waves at the InSight Lander.
[Grade: 6-8 | Topics: speed=distance/time; Time calculations; circumference of a circle]
[Check here]
Problem 472: Investigating Juno's Elliptical Transfer Orbit
Students use the Standard Formula for an ellipse to study the elliptical orbit of the Juno spacecraft, and relate specific properties of the
ellipse to features of the spacecrafts trajectory such as aphelion, perihelion, and ellipticity.
[Grade: 9-12 | Topics: formula for an ellipse; semi-major and minor axis]
[Check here]
Problem 471: Investigating the Launch of the Juno Spacecraft
Students use a series of images from a launch video to determine the scale of each image and
determine the speed of the rocket as it leaves the gantry.
[Grade: 6-8 | Topics: scale models; speed = distance/times]
[Check here]
Problem 470: The Launch of the Juno Spacecraft - Ascent to orbit
Students use tabulated altitude and range data following the launch of the Juno mission, to determine the speed of the rocket as it travels from the ground to earth orbit.
[Grade: 6-8 | Topics: scale models; speed = distance/time]
[Check here]
Problem 469: Solar Energy and the Distance of Juno from the Sun
Students use the formula for an ellipse, along with the inverse-square law to create a mathematical model that predicts
the declining solar power produced by Junos solar panels as the spacecraft travels from Earth to Jupiter.
[Grade: 9-12 | Topics: algebra; trigonometry; distance formula]
[Check here]
Problem 682:NASA�s Kepler Mission Detects 715 New Planets
Students work with the statistics of the detected candidate planets to estimate the number of planetary systems in the Milky Way and the number of earth-sized planets.
[Grade: 6-8 | Topics: percentage; histograms; population sampling; scaling and proportion ]
[Check here]
Problem 665: Kepler - Kepler�s Latest Count on Goldilocks Planets
Students examine the statistics of the latest candidate planets beyond our solar system, work with poercentages and a bar graph, and estimate the number of earth-like planets in our Milky Way.
[Grade: 6-8 | Topics: percentages, bar graphs, estimation]
[Check here] Problem 465: Comparing Planets Orbiting other Stars
Students use simple fraction arithmetic to determine the relative sizes of several new planets recently discovered by the Kepler mission,
and compare these sizes to that of Jupiter and Earth.
[Grade: 3-5 | Topics: scale models; proportions; fractions]
[Check here]
Problem 458: Playing Baseball on the Earth-like Planet Kepler-22b!
The recently-confirmed Earth-like planet Kepler-22b by the Kepler Observatory is a massive planet orbiting its star in the temperature zone suitable for liquid water. This problem explores the gravity and mass of this planet, and some implications for playing baseball on its surface!
[Grade: 8-10 | Topics: scale models; proportions; scientific notation; metric math; Evaluating equations]
[Check here]
Problem 444: Predicting the Transits of the Stars Kepler-16A and 16B from Tatooine - II
Students determine how often the two stars Kepler 16 A and B will line up with Tatooine on
the same day of the year. [Grade: 6-8 | Topics: comparing two sequences of numbers; patterns, Least Common Multiple]
[Check here]
Problem 443: Predicting the Transits of the Stars Kepler-16A and 16B from Tatooine - I
Students explore the orbit speeds of Tatooine and Kepler-16B and predict how often the two stars line up with the planet
to create an 'eclipse'. [Grade: 6-9 | Topics: angle measure; angular speed]
[Check here]
Problem 441: Exploring the new planet Kepler 16b called 'Tatooine'
Using the tangent function, students estimate the angular diameter and separation of the two stars in the Kepler 16 binary system as
viewed from the planet's surface...if it had one!! [Grade: 8-10 | Topics: angle measure; tangent]
[Check here]
Problem 416: Kepler probes the interior of red giant stars
Students use the properties of circular arcs to explore sound waves inside stars.
[Grade: 8-10 | Topics: geometry of circles and arcs; distance=speed x time]
[Check here]
Problem 403: The Goldilocks Planets - Not too hot or cold
Students use a table of the planets discovered by the Kepler satellite, and estimate the number of planets in our Milky Way galaxy that are about the same size as Earth and located in their Habitable Zones.
They estimate the average temperature of the planets, and study their tabulated properties using histograms.
[Grade: 6-8 | Topics: Averaging; histogramming]
[Check here]
Problem 402: Kepler- Earth-like planets by the score! II
Students use recent Kepler satellite data summarized in tabular form to estimate the number of planets in the Milky Way galaxy
that are about the same size as our Earth, and located in their Habitable Zones were liquid water may exist.
[Grade: 6-8 | Topics: Percentage; re-scaling sample sizes]
[Check here]
Problem 401: Kepler - Earth-like planets by the score! I
Students use recent Kepler satellite data to estimate the number of Earth-like planets in the Milky Way galaxy.
[Grade: 6-8 | Topics: Percentage; histograms; Re-scaling sample sizes]
[Check here]
Problem 400: The Most Distant Objects in the Universe
Students use a tabels of the most distant known events and objects in the universe to create a timeline of the universe soon after the Big Bang.
[Grade: 6-8 | Topics: Working with millions and billions; elapsed time]
[Check here]
Problem 396: Kepler 10b - A matter of gravity
Students use the measured properties of the Earth-like planet Kepler 10b to estimate the weight of a human on its surface.
[Grade: 8-10 | Topics: Evaluating formulas; mass = density x volume; volume of a sphere; scientific notation]
[Check here]
Problem 360: Kepler's First Look at 700 Transiting Planets
A statistical study of the 700 transits seen during the first 43 days of the mission. [Grade: 6-8 | Topics: Percentages; area of circle]
[Check here]
Problem 325: Kepler Spies Five New Planets
Students count squares on a Bizarro Star to study the transit of a planet, and determine the diameter of the planet.
This demonstrates the basic principle used by NASA's Kepler satellite to search for Earth-sized planets orbiting distant stars.
[Grade: 4-6 | Topics: Counting; graphing; area of a square]
[Check here]
Problem 225: Areas Under Curves; An astronomical perspective
Students work with a bar graph of the number of planet discoveries since 1995 to evaluate the total
discoveries, as areas under the graph, for various combinations of time periods.
[Grade: 6-8 | Topics: Adding areas in bar graphs.]
[Check here]
Problem 213: Kepler: The hunt for Earth-like planets
Students compare the area of a star with the area of a planet to determine how the star's light
is dimmed when the planet passes across the star as viewed from Earth. This is the basis for the 'transit'
method used by NASA's Kepler satellite to detect new planets.
[Grade: 6-8 | Topics: Area of circle; ratios; percents.]
[Check here]
Problem 607: The Launch of LADEE to the Moon
Students plot the altitude, range and speed of the LADEE rocket launch and investigate rates of change including acceleration by graphing the tabular data and determining the slope of the graph using the definition of the slope of a line between two points.
[Grade: 6-8 | Topics: Graphing tabular data; determining the slope of a line; rates of change]
[Check here]
Problem 512: New NASA Satellite Takes Pictures of Salton Sea
Students work with image of agricultural area to estimate the percentage of area cultivated and the total rainfall in gallons per year.
[Grade: 6-8 | Topics: area of square and rectangle; metric units; unit conversion]
[Check here]
Problem 484: Exploring Water Use in Kansas
Students use Landsat imagery from 1972 and 2011 to determine how much additional water is being used for irrigation in a small region of Kansas.
[Grade: 6-8 | Topics: Area of a circle; unit conversions ]
[Check here]
Problem 129: How Big is It? - The Moon up close.
Students work with an image taken by the Lunar Orbiter III spacecraft
to determine image scale, and search for the smallest things seen in a photograph.
[Grade: 4 - 7 | Topics:image scaling; multiply, divide, work with millimeter ruler]
[Check here]
Problem 127: How Big is It? - The Moon up close.
Students work with an image taken by the Lunar Orbiter IV spacecraft
to determine image scale, and search for the smallest things seen in a photograph.
[Grade: 4 - 7 | Topics:image scaling; multiply, divide, work with millimeter ruler]
[Check here]
Problem 445: LRO - The relative ages of lunar surfaces
Students examine two Apollo landing areas using images from the LRO spacecraft to estimate the relative ages of the two regions using
crater counting. [Grade: 6-8 | Topics: scale; histogramming]
[Check here]
Problem 440: LRO explores the Apollo 12 landing area on the moon
Students use a recent image obtained by the LRO spacecraft to estimate how far astronauts walked to get to various points in the
landing area.
They also estimate how many craters are in this area and the average impact time between crater events.
[Grade: 6-8 | Topics: image scale; metric measurement]
[Check here]
Problem 378: LRO Makes a Temperature Map of the Lunar South Pole
Students use the published LRO temperature map to study the scale of the south polar region, the sizes of its craters,
and estimate the volume of water-ice that may be present in the Shackleton Crater.
[Grade: 7-9 | Topics: Volume of a circular disk; scale models]
[Check here]
Problem 372: LRO Determines Lunar Cratering History
Students count large craters on an LRO coded image of the lunar surface to estimate whether the impacting asteroids
that produced the largest
craters were from the same population of asteroids during the two different epocs of impacts.
[Grade: 8-10 | Topics: Scaled images; histograming; inference]
[Check here]
Problem 321: Lunar Crater Frequency Distributions
Students use an image from the LRO satellite of the Apollo-11 landing area, along with a power-law
model of cratering, to determine what fraction of the landing area was safe to land upon.
[Grade: 11-12 | Topics: Integral calculus]
[Check here]
Problem 290: The Apollo-11 Landing Area at High Resolution
Students use recent images made by the LRO satellite to estimate distances, crater sizes, and how many tons of
TNT were needed to create some of the craters by meteor impact.
[Grade: 9-12 | Topics: metric measurement; scaling; A = B/C]
[Check here]
Problem 287: LCROSS Sees Water on the Moon
Students use information about the plume created by the LCROSS impactor to estimate the (lower-limit) concentration of
water in the lunar regolith in a shadowed crater.
[Grade: 9-12 | Topics: Geometry; volumes; mass=density x volume]
[Check here]
Problem 262: LRO Explores Lunar Surface Cratering
Students count the number of craters in various size ranges from a high-resolution image of the lunar surface.
[Grade: 6-8 | Topics: scale, proportion, ratio, area, density]
[Check here]
Problem 261: LRO - Searching for Lunar Boulders
Students use a recent image of the Apollo-11 landing area to search for large lunar boulders.
[Grade: 6-8 | Topics: scale, ratio, proportion]
[Check here]
Problem 259: Mare Nubium And Las Vegas
Students compare two satellite images taken at the same resolution to appreciate how large lunar features ae compared to more familiar objects.
[Grade: 8-10 | Topics: scale, proportion, ratio]
[Check here]
Problem 258: LRO's First Image of Mare Nubium
Students examine the first image of this lunar region using the high-resolution camera image provided by the Lunar Reconnaissance Orbiter.
[Grade: 6-8 | Topics: scale, ratio, proportion]
[Check here]
Problem 257: LRO and the Apollo-11 Landing Site
Students examine a map of the Apollo-11 landing area and determine how well various features
will be visible to the Lunar Reconnaissance Orbiter high-resolution camera.
[Grade: 6-8 | Topics: scale, proportion, ratios]
[Check here]
Problem 236: LRO Sees Apollo-11 on the Moon!
Students use the latest image from the Lunar Reconnaissance Orbiter of the Apollo-11 landing
site to explore lunar features at 1-meter resolution, and determine the solar elevation angle.
[Grade: 6-8 | Topics: scale; ratios; angle measure; right triangles]
[Check here]
Problem 507: Exploring the Launch of the Falcon 9
Students use data from the launch of the Falcon 9 booster to determine its speed and acceleration.
[Grade: 6-8 | Topics: speed=distance/time; Time calculations]
[Check here]
Problem 476: SpaceX launches the First Commercial Rocket to the ISS
Students detemine the volume of the Dragon capsule using the volume formula for a cone.
[Grade: 9-12 | Topics: Volumes of 3-d objects; cones; evaluating functions]
[Check here]
Problem 459: A piece of history - space shuttle thermal tiles
Students explore volume density and mass using the Space Shuttle thermal tiles.
[Grade: 6-8 | Topics: mass = density x volume; metric conversion]
[Check here]
Problem 438: The Last Flight of the Space Shuttle Endeavor
Students use tabular data and graphing to determine the launch speed and acceleration of the Space Shuttle from the launch pad. [Grade: 6-8 | Topics: tabular data, graphing, metric measurement, speed=distance/time]
[Check here]
Problem 437: Saturn V Rocket Launch Speed and Height
Students tabular data to determine the launch speed of the Saturn V rocket from the launch pad.
[Grade: 6-8 | Topics: tabular data, graphing, metric measurement, speed=distance/time]
[Check here]
Problem 436: Space Shuttle Challenger Deploys the INSAT-1B Satellite
Students use a sequence of images to determine the launch speed of the satellite from the Space Shuttle cargo bay.
[Grade: 6-8 | Topics: scale, metric measurement, speed=distance/time]
[Check here]
Problem 435: Apollo-17 Launch from Lunar Surface
Students use a sequence of images to determine the speed of ascent of the Apollo-17 capsule from the lunar surface.
[Grade: 6-8 | Topics: scale, metric measurement, speed=distance/time]
[Check here]
Problem 433: Space Shuttle Atlantis - Plume Speed
Students use a sequence of images from a video of the launch to determine speed from the time
interval between the images, and the scale of each image.
[Grade: 6-8 | Topics: scale, metric measurement, speed=distance/time]
[Check here]
Problem 432: Space Shuttle Atlantis - Exhaust Speed
Students use a sequence of images from a video of the launch to determine speed from the time
interval between the images, and the scale of each image.
[Grade: 6-8 | Topics: scale, metric measurement, speed=distance/time]
[Check here]
Problem 431: Space Shuttle Atlantis - Launch Speed
Students use a sequence of images from a video of the launch to determine speed from the time
interval between the images, and the scale of each image.
[Grade: 6-8 | Topics: scale, metric measurement, speed=distance/time]
[Check here]
Problem 430: Space Shuttle Atlantis - Ascent to Orbit
Students use a sequence of images from a video of the launch to determine speed from the time
interval between the images, and the scale of each image.
[Grade: 6-8 | Topics: scale, metric measurement, speed=distance/time]
[Check here]
Problem 419: The Space Shuttle: Fly me to the moon?
Students discuss the popular misconception that the Space Shuttle can travel to the moon by examining the required orbit speed change and the capacity of the Shuttle engines to provide the necessary speed changes.
[Grade: 6-8 | Topics: amount = rate x time ]
[Check here]
Problem 394: Apollo: Probing the lunar core using seismology
Students learn about the geometry needed to determine the diameter of the lunar core using a simplified model.
[Grade: 9-10 | Topics: Geometry; Properties of Inscribed Arcs]
[Check here]
Problem 346: The International Space Station and a Sunspot: Exploring angular scales
An amateur photograph of the International Space Station crossing in front of the sun is analyzed to determine the scales of sunspots. [Grade: 9-12 | Topics: Similar triangles; angular measure]
[Check here]
Problem 282: Exploring the Ares 1-X Launch: The Hard Climb to Orbit
Students learn about the energy required to send a payload into orbit by studying the Ares 1-X rocket launch.
[Grade: 8-10 | Topics: Algebra II]
[Check here]
Problem 281: Exploring the Ares 1-X Launch: Energy Changes
Students learn about kinetic and potential energy while studying the Ares 1-X rocket launch.
[Grade: 8-10 | Topics: Algebra II]
[Check here]
Problem 280: Exploring the Ares 1-X Launch: Parametrics
Students learn about parametric equations to determine the path of the Ares 1-X rocket.
[Grade: 8-10 | Topics: Algebra II; Parametric Equations]
[Check here]
Problem 279: Exploring the Ares 1-X Launch: Downrange Distance
Students learn about the path of the Ares 1-X test launch and calculate its downrange landing distance in the Atlantic Ocean.
[Grade: 8-10 | Topics: Algebra; Significant Figures; Metric to English Conversion]
[Check here]
Problem 276: Solid Rocket Boosters and Thrust
Students learn how solid rocket boosters work, and calculate the SRB Thrust Curve using a simple geometric model
and 'counting squares'..
[Grade: 8-10 | Topics: Geometry, Cylindrical volumes and surface areas, Graphing data]
[Check here]
Problem 266: The Ares-V Cargo Rocket
Students work with the equations for thrust and fuel loss to determine the acceleration curve of the Ares-V during launch.
[Grade: 11-12 | Topics: Algebra II, properties of functions, differential calculus, Excel Spreadsheet]
[Check here]
Problem 245: Solid Rocket Boosters
Students learn how SRBs actually create thrust, and study the Ares-V booster to estimate its thrust.
[Grade: 8-10 | Topics: volume, area, unit conversions]
[Check here]
Problem 243: ISS - Orbit Altitude Changes
Students read an essay describing the increases and decreases in the International Space Station orbit, and
calculate the final orbit altitude after all the changes are applied.
[Grade: 8-10 | Topics: combining positive and negative mixed numbers; fractions]
[Check here]
Problem 196: Angular Size and velocity
Students study a spectacular photo of the ISS passing across the face of the sun, and work out the angular sizes and speeds of the transit to figure out how long the event took in order to photograph it.
[Grade: 8-10| Topics: Geometry; Angle measurement]
[Check here]
Problem 185: The International Space Station: Follow that graph!
Students use a plot of the orbit altitude of the ISS to pblackict its re-entry year after the peak of the next solar activity cycle.
[Grade: 6-8| Topics: extrapolating a simple graph; estimation; forecasting]
[Check here]
Problem 125: How Big is It? - Washington DC up close.
Students work with an image taken by ISS astronauts to determine image scale, and search for the smallest things seen in a photograph.
[Grade: 4 - 7 | Topics:image scaling; multiply, divide, work with millimeter ruler]
[Check here]
Problem 95: A Study on Astronaut Radiation Dosages in Space
Students will examine a graph of the astronaut radiation dosages for Space Shuttle flights, and estimate the
total dosages for astronauts working on the International Space Station.
[Grade level: 9-11 | Topics:Graph analysis, interpolation, unit conversion]
[Check here]
Problem 36: The Space Station Orbit Decay and Space
Weather > Students will learn about
the continued decay of the orbit of the International Space Station by
studying a graph of the Station's altitude versus time. They will
calculate the orbit decay rates, and investigate why this might be
happening. [Grade: 5 - 8 | Topics: Interpreting graphical data; decimal math]
[Check here]
[Check here]
Problem 113: NASA Juggles Four Satellites at Once!
Students will learn about NASA's Magnetospheric Multi-Scale (MMS) satellite mission, and how
it will use four satellites flying in formation to investigate the mysterious process
called Magnetic Reconnection that causes changes in Earth's magnetic field. These changes
lead to the production of
the Northern and Southern Lights and other phenomena. From the volume formula for a tetrahedron, they will calculate the volume of several satellite configurations
and estimate the magnetic energy and travel times for the particles being studied by MMS.
[Grade: 8-10 | Topics: Formulas with two variables; scientific notation]
Problem 602: Transit of Phobos Across the Sun Viewed from Mars
Students investigate the geometry of a martian moon passing across the face of the sun using angular measure and proportions.
[Grade: 6-8 | Topics: proportions; angle measure; similar triangles]
[Check here]
Problem 591: The Occulting Moons of Mars
Students explore the moons of mars and their eclipses during an event seen by the Curiosity rover on August 1, 2013.
[Grade: 6-8 | Topics: working with poroportions; angular measure; geometry]
[Check here]
Problem 500: Curiosity Uses X-Ray DIffraction to Identify Minerals on Mars
Students learn about diffraction geometry and then estimate the distance between crystal planes in a mars rock sample.
[Grade: 10-12 | Topics: geometry; trigonometry]
[Check here]
Problem 491: The Curiosity Rover on the Move.
Students plot the position of the Curiosity Rover on a cartesian grid covering the satellite image of the landing area. They use the 2-point distance formula to determine how far the rover
traveled between stops, and determine it speed.
[Grade: 6-8 | Topics: Cartseian graphs; ordered pairs and coordinates; distance = speed x time; metric measure ]
[Check here]
Problem 485: Curiosity Discovers Ancient Mars River
Students estimate the speed of an ancient mars river using images from the Curiosity rover.
[Grade: 9-12 | Topics: Algebra; trigonometry; evaluating functions ]
[Check here]
Problem 479: Exploring Gale Crater with the Curiosity Rover
Students explore the Gale Crater landing area and calculate rover distances to
various way stations to determine the round trip distance and travel time.
[Grade: 9-12 | Topics: Pythagorean Distance Formula; Coordinate geometry ]
[Check here]
Problem 457: The Interplanetary Voyage of MSL
Students use the properties of ellipses to determine the formula for the Hohmann Transfer Orbit taking the Mars Science Laboratory to Mars in 2012
[Grade: 10-11 | Topics: time=distance/speed; scale models; metric math; properties of ellipses]
[Check here]
Problem 456: The Launch of the Mars Science Laboratory (MSL) in 2011
Students use a sequence of launch images to determine the Atlas V's launch speed and acceleration. By determining the scale of each image, they estimate average speeds during the first 4 seconds after lift-off.
[Grade: 8-10 | Topics: time=distance/speed; scale models; metric math]
[Check here]
Problem 393: Taking a stroll around a martian crater!
Students use a recent photograph of a crater on Mars to estimate its circumference and the time it will take NASAs Opportunity Rover to travel once around its edge.
[Grade: 6-8 | Topics: scale model; distance = speedxtime; metric measure]
[Check here]
[Check here]
Problem 237: The Martian Dust Devils
Students determine the speed and acceleration of a martian dust devil from time laps images and information about the scale of the image.
[Grade: 6-8 | Topics: scales; Determining speed from sequential images; V = D/T
Problem 139: How Big Is It? - Mars
Students use an image of a crater wall on mars to investigate ancient
water gullies discovered in 2008 by the Mars Orbiter.
[Grade: 4 - 7 | Topics:image scales; metric measurement; division and multiplication; decimals]
[Check here]
Problem 133: How Big is It? - The Mars Rover.
Students work with an image taken by the Mars Orbiter
satellite of the Spirit landing site. They
determine the image scale, and calculate the sizes of various surface features from the image.
[Grade: 4 - 7 | Topics:image scaling; multiply, divide, work with millimeter ruler]
[Check here]
Problem 126: How Big is It? - A Martian Avalanche!
Students work with a Mars reconnissance Orbiter image to determine image scale, and search for
the smallest things seen in a photograph.This avalanche was caught as it occurred on February 19, 2008!
[Grade: 4 - 7 | Topics:image scaling; multiply, divide, work with millimeter ruler]
[Check here]
Problem 74: A Hot Time on Mars
The NASA Mars Radiation Environment (MARIE) experiment has created a map of the surface of mars, and measured the ground-level radiation background that astronauts would be exposed to.
This math problem lets students examine the total radiation dosage that these explorers would receive on a series of 1000 km journeys across the martian
surface. The students will compare this dosage to typical background conditions on earth and in the International Space Station to get a sense of perspective
[Grade level: 6-8 | Topics: decimals, unit conversion, graphing and analysis ]
[Check here]
Problem 70: Calculating Total Radiation Dosages at Mars
This problem uses data from the Mars Radiation Environment Experiment (MARIE) which is orbiting Mars, and measures the daily radiation dosage
that an astronaut would experience in orbit around Mars. Students will use actual plotted data to calculate the total dosage by adding up the areas under the data curve. This
requires knowledge of the area of a rectangle, and an appreciation of the fact that the product of a rate (rems per day) times the time duration (days) gives a total dose (Rems), much like the product of speed times time gives distance.
Both represent the areas under their appropriate curves. Students will calculate the dosages for cosmic radiation and solar proton flares, and decide which component produces the most severe radiation problem.
[Grade level: 6-8 | Topics: decimals, area of rectangle, graph analysis]
[Check here]
Problem 474: MESSENGER Explores the Interior of Mercury
Students work with a simple spherical core and shell model to determine the interior structure of mercury and the size of its dense iron core.
[Grade: 9-12 | Topics: working with volumes of speheres; mass = density x volume]
[Check here]
Problem 473: MESSENGER Explores the Mass of Mercury
Students use the orbit of NASA's MESSENGER spacecraft to determine the mass of Mercury.
[Grade: 9-12 | Topics: working with equations with integer powers and solving for specified values; scientific notation]
[Check here]
Problem 415: Mercury and the Moon - Similar but different
Students explore the mass and volume of mercury compared to the moon by using the formula for a sphere and scale changes.
[Grade: 8-10 | Topics: scale; volume of a sphere; mass = density x volume]
[Check here]
Problem 121: Ice on Mercury?
Since the 1990's, radio astronomers have mapped Mercury.
An outstanding curiosity
is that in the polar regions, some craters appear to have 'anomalous reflectivity' in
the shadowed areas of these craters. One interpretation is that this is caused by
sub-surface ice. The MESSENGER spacecraft hopes to explore this issue in the next few years.
In this activity, students
will measure the surface areas of these potential ice deposits an calculate the
volume of water that they imply.
[Grade: 8-10 | Topics:Area of a circle; volume, density, unit conversion]
[Check here]
Problem 143: So..How big is it? - Asteroid Eros surface
Students calculate the scale of an image of the surface of the asteroid Eros
from the NEAR mission, and
determine how big rocks and boulders are on its surface.
[Grade: 4 - 7 | Topics: Scaling; multiplication, division; metric measure]
[Check here]
Exploring the Dwarf Planets
Scientists can learn a lot about the inside of a dwarf planet by making very precise measurements
of its diameter and mass. From these measurements, average densities (mass divided by volume) can be
figured out. The density of an object gives us a clue as to whether it is mostly rocky or mostly icy.
[Grade: 6-8 | Topics: density; mass]
[Check here]
Exploring the Dwarf Planet Ceres
Counting and measuring craters on Ceres can provide insights into the cratering process that created
its surface. It appears to have fewer large craters than scientists had expected to see, a possible
indication that most of the material that came together to form Ceres was smaller asteroids.
[Grade: 6-8 | Topics: scale; proportion]
[Check here]
Triton: The Twin of Pluto?
Triton is only slightly larger than Pluto. Both worlds have similar surface materials, such as nitrogen,
methane and carbon monoxide. Their diameters, masses and densities are amazingly similar.
[Grade: 6-8 | Topics: volume=area x height; rates;volume of a sphere]
[Check here]
The Amazing Journey to Pluto!
Deep space missions can take up to 10 years from development to launch. For New Horizons, it took
close to 20 years from the time that scientists conceived of the mission to the time it reached its destination!
[Grade: 6-8 | Topics: speed; time; unit conversion]
[Check here]
Exploring Interplanetary Communication
On July 14, 2015, NASA’s New Horizons spacecraft reaches dwarf planet Pluto and begins sending data back to
Earth. At that time, the distance from Earth to Pluto is 4.8 billion kilometers. At the speed of light,
one-way radio signal travel time is 16,000 seconds or 4 hours and 27 minutes.
[Grade: 6-8 | Topics: distance; speed; time]
[Check here]
Problem 101: Super-Fast Solar Flares!!
Students will analyze consecutive images taken of an erupting solar flare, and use
the information provided to calculate the speed of the flare.
[Grade level: 6-9 | Topics:image scales; time calculations; speed calculations]
[Check here]
Problem 625: SCOOL-Cloud Droplets and Rain Drops
Students
[Grade: 6-8 | Topics: Volume of a sphere; scientific notation ]
[Check here]
Problem 624: SCOOL-Cloud Cover, Albedo, Transmission and Opacity
Students explore the concepts of albedo, transmission and opacity for clouds.
[Grade: 9-12 | Topics: logarithmic functions; percentage]
[Check here]
Problem 623: SCOOL-Cloud Cover and Solar Radiation
Students examine the relationship between percentage cloud cover and the amount of sunlight that reaches the ground.
[Grade: 6-8 | Topics: Graph analysis; evaluating functions]
[Check here]
Problem 622: SCOOL-How Clouds Form - Working with Dew Points and Rates of Change
Students learn about the dew point and how clouds form from humid, cooling air.
[Grade: 6-8 | Topics: Percentage; rates of change ]
[Check here]
Problem 621: SCOOL-Working with Rainfall Rates and Water Volume
Students learn about rain fall rates and how to convert them into the volume of water that falls.
[Grade: 9-12 | Topics: scientific notation; rates of change ]
[Check here]
Problem 620: SCOOL-Estimating the Mass of a Cloud
Students use the relationship between volume and density to estimate the mass of a common cumulus cloud.
[Grade: 6-8 | Topics: Volume of a sphere; scientific notation; mass = density x volume]
[Check here]
Problem 619: SCOOL-Using Proportions to Estimate the Height of a Cloud
Students use the method of triangulation to determine the height of a cloud.
[Grade: 6-8 | Topics: geometry of right triangles; proportions]
[Check here]
Problem 666: SAGE - The Ground Track of the International Space Station
Students determine how many sunrises and sunset the SAGE will observe every day.
[Grade: 6-8 | Topics: Working with proportions; time calculations]
[Check here]
Problem 662: SAGE- Measuring Aerosol Concentration in Parts per Million
Students learn about parts-per-million units by working with percentage and counting squares in different types of grids.
[Grade: 6-8 | Topics: Unit conversion; integer counting]
[Check here]
Problem 661: SAGE- Measuring Stratospheric Ozone with SAGE-III
Students use a data graph to identify the ozone layer from its concentration of ozone, and use parts-per-million to compare ozone concentration to the atmosphere density.
[Grade: 6-8 | Topics: Unit conversion; reading a data graph ]
[Check here]
Problem 660: SAGE- Some Basic Properties of the SAGE-III Instrument
Students examine the mass, data, pointing accuracy and power of the SAGE-III instrument and use unit conversions to translate the units into pounds, watts and degrees.
[Grade: 6-8 | Topics: Unit conversion; proportions ]
[Check here]
Problem 648: SAGE- Using Opacity to Find Aerosol Density
Students examine a mathematical model based on the SAGE geometry and see how it leads to solving a system of linear equations to determine aerosol concentrations at different altitudes.
[Grade: 6-8 | Topics: solving a system of linear equations; scientific notation]
[Check here]
Problem 647: SAGE- Investigating Opacity and Extinction
Students work with the properties of filters to prove that the product of exponentials leads to the sum of their exponents.
[Grade: 9-12 | Topics: exponential functions; exponent math]
[Check here]
Problem 646: SAGE- Air Quality Index and Aerosol Density
Students see how the Air Quality Index is related to the number of aerosols per cubic meter.
[Grade: 6-8 | Topics: density; scientific notation; volume of a sphere; density]
[Check here]
Problem 645: SAGE- Exploring the Mass and Density of Aerosol Particles
Students explore the physical sizes of aerosol particles. With unit conversions they convert concentration units of micrograms/m3 to particles/m3.
[Grade: 6-8 | Topics: Unit conversions; scientific notation; volume of a sphere; density]
[Check here]
Problem 644: SAGE- A Scale Model of Aerosol Sizes
Students work with proportions and scale to create a scale model of aerosol particles.
[Grade: 6-8 | Topics: unit conversion; metric units nano and micro]
[Check here]
Problem 643: SAGE- The Sources and Sinks of Carbonyl Sulfide
Students explore a molecule important in forming stratospheric aerosols. They calculate total rates of change from
a table of sources and sinks, and estimate the change in the number of molecules per year.
[Grade: 6-8 | Topics: Scientific notation; rates]
[Check here]
Problem 642: SAGE-Three Mathematical Ways to Describe Light Extinction
Studens explore the three common ways that scientists record extinction using base-10 and base-e functions.
[Grade: 9-12 | Topics: Bae-10 and Base-e functions; exponential equations]
[Check here]
Problem 641: SAGE- A Study of Aerosol Extinction in the Stratosphere
Students work with a table of atmospheric extinction at different altitudes and latitudes to graph selected data and draw a straight line thrlough the graphed data to estimate the slope. They create a linear equation from the graph and use it to predict the extinction at a different altitude.
[Grade: 6-8 | Topics: slope of a line; linear equations; forecasting]
[Check here]
Problem 640: SAGE- Atmospheric Aerosols by Percentage
Students examine a table that lists the percentages of different aerosol types according to the location on Earth where they are produced.
[Grade: 3-5 | Topics: percentages; interpreting tabular data]
[Check here]
Problem 639: SAGE- Aerosol Sources in the Stratosphere
Students examine the sources for aerosols in the atmosphere and determine their percentage contributions
based upon their individual rates given in megatons/year.
[Grade: 6-8 | Topics: Rates; percentage; pie graphs]
[Check here]
Problem 638: SAGE- Sunset and Sunrise Geometry
Students explore the tangent geometry used by the SAGE-III instrument, and work with chords to determine their lengths using the Pyhtagorean formula.
[Grade: 9-12 | Topics: Pythagorean Theorem; chord lengths]
[Check here]
Problem 637: SAGE-Light Attenuation Using Exponential Functions
Students work with the extinction formula for light and see how light dimming is an exponetial process.
[Grade: 9-12 | Topics: exponential functions; natural logarithm, e]
[Check here]
Problem 636: SAGE-Aerosols and Light Dimming
Students explore how light is dimmed as it passes through a series of filters.
[Grade: 6-8 | Topics: percentage; multiplication ]
[Check here]
Problem 635: SAGE- Exploring Aerosols
Students compare aerosol sizes to a human hair, calculate volumes and masses from density.
[Grade: 6-8 | Topics: density; volume; scale ]
[Check here]
Problem 299: Changing Perspectives on the Sun's Diameter
Students compare two images of the sun taken by the SOHO satellite to measure the apparent diameter
change from different earth obit locations in the winter and summer.
[Grade: 6-8 | Topics: measurement; parallax; metric units; percentage change]
[Check here]
Problem 244: Solar Storms - Fractions and Percentages
Students create a Venn Diagram to summarize data on a series of solar storms, and determine how often solar flares occur
when a solar plasma eruption happens.
[Grade: 4-7 | Topics: precentages; Venn Diagramming]
[Check here]
Problem 176: Solar Storms: Sequences and Probabilities I
Students continue their study of a stormy week on the sun by working out the probabilities for joint events.
[Grade: 4-7| Topics: probability; numerating possible outcomes]
[Check here]
Problem 175: Solar Storms: Sequences and Probabilities II
Students work out the probabilities for various combinations of solar storms during a given week.
[Grade: 4-7| Topics: probability; numerating possible outcomes]
[Check here]
Problem 117: CME Kinetic Energy and Mass
Coronal Mass Ejections (CMEs) are giant clouds of plasma
released by the sun at millions of kilometers per hour. In this activity, students
calculate the kinetic energy and mass of several CMEs to determine typical mass
ranges and speeds. Students will use the formula for kinetic energy to fill-in
the missing entries
in a table. They will then use the completed table to answer some basic questions
about CMEs.
[Grade: 8-10 | Topics:time calculation; Evaluating a simple equation; solving for variables]
[Check here]
Problem 94 : Solar Storms: Odds, Fractions and Percentages
Students will use actual data on solar storms to learn
about the
different kinds of storms and how common they are. This is a basic science activity that
professionals do in order to look for relationships between different kinds of events
that might
lead to clues about what causes them. Can your students come up with something new that
noone has thought about before? The Venn Diagramming activity is a key element of the activity and is reasonably challenging!
[Grade level: 6-8 | Topics: Averaging; fractions; percentages; odds; Arithmetic Operations; Venn Diagrams]
[Check here]
Problem 80 : Data Corruption by High Energy Particles
Students will see how solar flares can corrupt satellite data, and
create a timeline for a spectacular episode of data loss recorded by the SOHO satellite using
images obtained by the satellite. Students will also calculate the
speed of the event as particles are ejected from the sun and streak towards earth.
[Grade level: 6-8 | Topics: Time and speed calculations; interpreting scientific data ]
[Check here]
Problem 43: An Interplanetary Shock Wave
On November 8, 2000 the sun released a coronal mass ejection that traveled to Earth, and its effects were
detected on Jupiter and Saturn several weeks later. In this problem, students will use
data from this storm to track its speed and acceleration as it traveled across
the solar system. [Grade level: 6-10 | Topics: Time calculations; distance = speed x time ]
[Check here]
Problem 7: Solar Flares, CME's and Aurora
Some articles about the Northern Lights imply that
solar flares cause them. Students will use data to construct a simple Venn
Diagram, and answer an important question about whether solar flares cause
CME's and Aurora. [Grade: 5 - 7 | Topics: Venn Diagramming]
[Check here]
Problem 5: The November 8, 2004 solar storm
Students calculate the speed of a CME, and describe
their aurora observations through writing and drawing.
[Grade: 6 - 8 | Topics: Time calculations; distance = speed x time]
[Check here]
Problem 537:A Solar Storm Number Puzzle
Students solve 10 problems using positive and negative numbers, addition, subtraction and multiplication
to find the missing words in a short essay about solar storms.
[Grade:3-5 | Topics: integer arithmetic; positive and negative numbers]
[Check here]
Problem 505: SDO Sees Coronal Rain - Estimating Plasma Speeds
Students estimate the speed of plasma streamers near the solar surface using images from a Solar Dynamics Observatory.
[Grade: 6-8 | Topics: scale models; speed=distance/time; proportions]
[Check here]
Problem 467: Estimating Magnetic Field Speeds on the Sun
Students use two images from the Solar Dynamics Observatory to estimate the speed of the X-class solar flare on March 6, 2012.
[Grade: 6-8 | Topics: speed=distance/time; scale model; metric measurement]
[Check here]
Problem 337: SDO Reveals Details on the Surface of the Sun
Students use a spectacular colored image of the Sun to calculate the scale of the image in kilometers per millimeter, and then
search for the smallest features relative to the size of Earth.
[Grade: 6-8 | Topics: image scales; proportions]
[Check here]
Problem 336: SDO: Measuring the Speed of an Eruptive Prominence
Students use recent First Light images of the Sun from SDO to calculate the speed of a prominence using a sequence of scaled images
and computing position shift over the time interval of the images.
[Grade: 6-8 | Topics: image scales; speed=distane/time ]
[Check here]
Problem 334: Solar Dynamics Observatory: Working with Giga,
Tera, Peta and Exabytes
The recent launch of SDO will bring 'high definition TV' to the study of the sun's surface details. This also means a HUGE amount of data
will have to be processed every day to handle the torrent of information. This activity works with the prefixes
giga, tera, peta and exa to familiarize students with how to interpret these quantities in a practical setting. Students already know about 'gigabytes', but
the SDO data stream represents terabytes per day, and petabytes per year in data storage demands.
[Grade: 8-12 | Topics: powers of ten; time conversion: seconds, minutes, days, years]
[Check here]
Problem 235: Scientific Data: The gift that keeps on giving!
Students learn about gigabytes and terrabytes of data and the rates of data
generation by NASA missions and how to store it.
[Grade: 6-8 | Topics: metric units; rates; money]
[Check here]
Problem 692: Exploring Interplanetary Dust with the Parker Solar Probe
Students examine the impact frequency of dust grains in the vicinity of the Parker Solar Probe orbit around the sun, and estimate how many impact will occur during the mission.
[Grade: 8-10 | Topics: rates; areas; proportions; geometry ]
[Check here]
Problem 691: Investigating the Elliptical Orbit of the Parker Solar Probe
Students work with the basic algebraic properties of ellipses to determine the orbit of the spacecraft and its period.
[Grade: 10 | Topics: Geometry; conic sections; properties of ellipses]
[Check here]
Problem 690: Exploring Proton Storms with the Parker Solar Probe
Students use solar storm data near Earth to estimate how often the spacecraft will encounter solar storms and estimate how much power will be lost from the solar panels due to radiation damage.
[Grade: 8-10 | Topics: proportions; inverse-square law; probability]
[Check here]
Problem 689: Exploring Solar Heating with the Parker Solar Probe
Students calculate the temperature of the heat shield and how much heat energy the shield has to dissipate to keep the spacecraft from over-heating.
[Grade: 8-10 | Topics: algebra; scientific notation]
[Check here]
Problem 688: Exploring Solar Energy with the Parker Solar Probe
Students examine how solar panels collect energy and estimate how much electrical power the spacecraft will require for operation.
[Grade: 8-10 | Topics: rectangular area; rates; inverse-square law; unit conversions ]
[Check here]
Problem 687: Exploring Equations with the Parker Solar Probe
Students work with the masses of various spacecraft systems expressed as fractions, and create and solve algebraic equations to determine the masses of these systems.
[Grade: 8-10 | Topics: algebraic fractions; solving lineqar equations ]
[Check here]
Problem 686: Exploring Orbital Speeds with the Parker Solar Probe
Students work with an equation for spacecraft speed along its orbit to determine the speed of the Parker Solar Probe spacecraft as it orbits the sun.
[Grade: 8-10 | Topics: Algebra; evaluating functions; scientific notation]
[Check here]
Problem 685: Exploring Fractions with the Parker Solar Probe
Students use fractions to calculate the mass of various spacecraft systems
[Grade: 3-5 | Topics: adding, subtracting, multiplying simple fractions ]
[Check here]
Problem 684: Exploring the Pressure of Sunlight with the Parker Solar Probe
Students calculate the light pressure on the heat shield, and use F=ma to calculate acceleration.
[Grade: 8-10 | Topics: Unit conversions, area of rectangle; working with F=ma]
[Check here]
Problem 683: Exploring the Parker Solar Probe Heat Shield
Students examine the mass and density of the heat shield by calculating its volume and uding the density formula.
[Grade: 6-8 | Topics: volume of a rectangular solid; mass=density x volume ]
[Check here]
Problem 373: The Parker Solar Probe - Having a hot time near the sun!
Students use a simple equation to estimate the temperature reached by the Solar Probe spacecraft as it gets close to the sun.
[Grade: 8-10 | Topics: Evaluating a function; square roots and forth roots]
[Check here]
Problem 366: The Parker Solar Probe - Working with angular diameter
Students use the tangent formula to determine the angular diameter of the sun as seen by the
Solar Probe spacecraft as it approaches the sun.
[Grade: 8-10 | Topics: angular measure; tangent formula; angular size]
[Check here]
Problem 278: Spitzer Studies the Distant Planet Osiris
Students learn about the density of the planet HD209458b, also called Osiris, and compare it to that of Jupiter.
[Grade: 8-10 | Topics: Spherical volumes; density; Scientific Notation;]
[Check here]
Problem 272: Spitzer Telescope Discovers New Ring of Saturn!
Students calculate the volume of the ring and compare it to the volume of Earth to check a news release figure that
claims 1 billion Earths could fit inside the new ring.
[Grade: 8-9 | Topics: Geometry, Algebra, volumn, scientific notation]
[Check here]
Problem 148
>Exploring a Dying Star
Students use data from the Spitzer satellite to calculate the mass of a planetary nebula from a dying star.
[Grade: 9 - 11 | Topics:Scientific Notation; unit conversions; volume of a sphere ]
[Check here]
Problem 141: Exploring a Dusty Young Star
Students use Spitzer satellite data to learn about how dust emits infrared light and
calculate the mass of dust grains from a young star in the nebula NGC-7129.
[Grade: 4 - 7 | Topics: Algebra I; multiplication, division; scientific notation]
[Check here]
Problem 56: The Sombrero Galaxy Close-up
The Sombrero Galaxy in Virgo is a dazzling galaxy through the telescope,
and has been observed in detail by both the Hubble Space Telescope and the Spitzer Infrared Observatory.
This exercise lets students explore the dimensions of this galaxy as well as its finest details, using simple
image scaling calculations.
[Grade level: 9-11 | Topics: Finding the scale of an image; measurement; decimal math]
[Check here]
Problem 455: The Night Launch of STEREO in 2006
An example of old news seen in a different way! Students use a spectacular time-lapse photo of the launch of the STEREO mission obtained by photographer Dominic Agostini in 2006 to study parabolic curves.
[Grade: 8-10 | Topics: time=distance/speed; scale models; metric math; equation of a parabola; curve fitting]
[Check here]
Problem 404: STEREO Spacecraft give 360-degree Solar View
Students use STEREO satellite images to determine which features can be seen from Earth and which cannot. They learn about the locations and changing positions of the satellites with respect to Earth's orbit.
[Grade: 6-8 | Topics: angular measure, extrapolation; distance = speed x time]
[Check here]
Problem 298: Seeing Solar Storms in STEREO - II
Students explore the geometry of stereo viewing by studying a solar storm viewed from two satellites.
[Grade: 10-12 | Topics: Geometry; Trigonometry]
[Check here]
Problem 286: STEREO Watches the Sun Kick Up a Storm
Students use images from the STEREO observation of a 'solar tsunami' to estimate its speed and kinetic energy.
[Grade: 9-12 | Topics: metric measurement; scaling; Scientific Notation; unit conversion; evaluating
a simple 2-variable formula for kinetic energy ]
[Check here]
Problem 248: Seeing Solar Storms in STEREO - I
Students work out the details of stereoscopic vision using elementary properties of triangles and the Law of Cosines
to determine the distance from earth of a solar storm cloud.
[Grade: 8-10 | Topics: geometry, Law of Cosines, V = D/T]
[Check here]
Problem 207: The STEREO Mission: getting the message across
Students learn about how the transmission of data is affected by how far away a satellite is for the two satellites in the STEREO constellation.
[Grade: 6-8| Topics: multiplication; division; decimal numbers.]
[Check here]
Problem 206: Can You Hear me now?
Students learn about how the transmission of data is affected by how far away a satellite is, for a variety of spacecraft in the solar system
[Grade: 6-8| Topics: multiplication; division; decimal numbers.]
[Check here]
Problem 118: An Application of the Parallax Effect
The STEREO mission views the sun from two different locations in space. By combining this data, the parallax
effect can be used to determine how far above the solar surface various active regions are located. Students use the Pythagorean Theorem, a bit of
geometry, and some actual STEREO data to estimate the height of Active Region AR-978.
[Grade: 8-10 | Topics:Pythagorean Theorem; square-root; solving for variables]
[Check here]
Problem 116: The Comet Encke Tail Disruption Event
On April 20, 2007 NASA's STEREO satellite captured a rare
impact between a comet and the fast-moving gas in a solar coronal mass ejection. In this problem, students
analyze a STEREO satellite image to determine the speed of the tail disruption event.
[Grade: 8-10 | Topics:time calculation; finding image scale; calculating speed from distance and time]
[Check here]
Problem 92: A Lunar Transit of the Sun from Space
One of the STEREO satellites observed the disk of the moon pass across the sun. Students will use simple geometry to determine how far
the satellite was from the moon and Earth at the time the photograph was taken.
[Grade level: 9-11 | Topics: Geometry; parallax; arithmetic]
[Check here]
Problem 442: Modeling the Atmospheric Re-entry of UARS
Students graph the altitude of the UARS satellite in the weeks before re-enrty to explore the accelerating
effects of atmospheric drag. They create a mathematical model that fits the data, and use this to make their own
prediction of the re-entry date. [Grade: 8 - 11 | Topics: graphing data; linear equations; exponential and power functions]
[Check here]
Problem 406: Growing Grapes in the Middle of the Desert
Students use a dramatic Earth Observatory-1 satellite image of agriculture in Namibia to estimate the total cultivated
area and water needs of grape growing under desert conditions
[Grade: 6-8 | Topics: areas of irregular regions; unit conversion]
[Check here]
Problem 375: Terra Satellite Measures Dangerous Dust
Students determine the number of dust particles inhaled by using a satellite map of the dust concentration and a
calculation of the mass of a typical dust grain.
[Grade: 8-10 | Topics: unit conversion; scientific notation; mass=densityxvolume]
[Check here]
Problem 339: Terra Satellite Spies the Great Gulf Oil Catastrophe of 2010
Students use a Terra satellite image of the oil slick in the Gulf of Mexico to calculate its area, mass and thickness.
[Grade: 6-8 | Topics: image scales; area of a circle; metric conversions ]
[Check here]
Problem 201: Fly Me To the Moon!
Students learn some basic principles and terminology about how spacecraft change their orbits to get to the moon.
[Grade: 6-8| Topics: speed = distance/time; Pythagorean Theorem]
[Check here]
Problem 194: A Magnetic Case for 'What Came First?'
Students create a timeline for events based on several data plots from the THEMIS program, and use their timeline to answer questions about the causes of magnetic storms.
[Grade: 6-8| Topics: Time calculations]
[Check here]
Problem 108: A Problem in Satellite Synchrony
The THEMIS program uses five satellites in five different
orbits to study Earth's magnetic field
and its changes during a storm. This problem asks students to use the periods of the
five satellites to figure out
when all 5 satellites will be lined-up
as seen from Earth. They will do this by finding the Greatest Common Multiple of the
five orbit periods, first for the case of 2 or 3 satellites, which can be easily
diagrammed with concentric circles,
then the case for all five satellites together.
[Grade: 5-9 | Topics:multiplication; Greatest Common Multiple]
[Check here]
Problem 3: Magnetic Storms II
>Students learn about the Kp index using a bar graph.
They use the graph to answer simple questions about maxima and time.
[Grade: 6 - 8 | Topics: Interpreting bar graphs; time calculations]
[Check here]
Problem 1: Magnetic Storms I
> Students learn about magnetic storms using real data
in the form of a line graph. They answer simple questions about data
range, maximum, and minimum. [Grade: 7 - 9 | Topics: Interpreting a graph; time calculations]
Problem 175: Solar Storms: Sequences and Probabilities II -
Students work out the probabilities for various combinations of solar storms during a given week.
[Grade: 4-7| Topics: probability; numerating possible outcomes]
[Check here]
Problem 104: Loopy Sunspots!
Students will analyze data from the Hinode satellite to determine the volume and mass of a
magnetic loop above a sunspot. From the calculated volume, based on the formula for the volume of a cylinder, they will use the density of the plasma determined by
the Hinode satellite to determine the mass in tons of the magnetically trapped material.
[Grade: 9-11 | Topics:image scales; cylinder volume
calculation; scientific notation; unit conversions]
[Check here]
Problem 678:VAB-Navigating a Magnetic Field with Vector Dot Products!
Students work with vectors to determine a spacecrafts orientation relative to Earths magnetic field. They compute the expected strength of the magnetic field parallel and perpendicular to the spacecraft motion vector.
[Grade: 10-12 | Topics: vectors; dot products; vector projections ]
[Check here]
Problem 677:VAB-Navigating in a Magnetic Field Using Linear Equations
Students model spacecraft motion and the local magnetic field direction using two linear equations, then determine the line perpendicular to the spacecraft motion and the angle of motion relative to the magnetic field.
[Grade: 8-10 | Topics: graphing linear equations; equation of line perpendicular to another line; geometry ]
[Check here]
Problem 676:VAB-Navigating in a Magnetic World!
Students explore how some satellites navigate in space using Earth's magnetic field and its orientation to the spacecraft.
[Grade: 7-10 | Topics: coordinate plotting; geometry; graphing data ]
[Check here]
Problem 675:VAB-Earth�s Magnetic Field and the Van Allen Probes
Students explore Earth's magnetic field as seen by spacecraft in their orbit to determine the local 'compass direction' of the magnetic field.
[Grade: 7-10 | Topics: coordinate plotting; properties of right triangles; Pythagorean theorem]
[Check here]
Problem 674:VAB - Exploring the Orbit of the Van Allen Probes
Students explore the speed of the spacecraft in their orbit around Earth using coordinate graphing, time differences, pythagorean theorem and unit conversions.
[Grade: 7-10 | Topics: coordinate plotting; unit conversion; rates ]
[Check here]
Problem 673:VAB - An Improved Model for Van Allen Belt Radiation Dose
Students use a detailed model of the path of a satellite and the radiation dose rate along the path to calculate the total radiation dose to the spacecraft.
[Grade: 9-11 | Topics: Polynomial equations; trigonometric equations; composite functions f(g(x)); estimating areas under curves]
[Check here]
Problem 672:VAB - Modeling the Radiation Dose of the Van Allen Probes
Students create a simple mathematical model of the radiation exposure to the VABP satellites as they travel through the Van Allen belts.
[Grade: 11-12 | Topics: Parametric equations;composite functions f(g(x)); integral calculus ]
[Check here]
Problem 671:VAB - The Van Allen Probes and Radiation Dose
Students study radiation dose units and estimate the exposures for a human living on the gropund; an astronaut in the ISS, and the Van Allen belt environment.
[Grade: 8-10 | Topics: Unit conversion; rates]
[Check here]
Problem 669: VAB - Exploring the Third Belt with the Van Allen Probes
Students use the elliptical equation for the orbit of NASAs Van Allen Probes spaccecraft, and a circle representing the location of the new Van Allen belt, to find where they intersect along the orbit of the spacecraft.
[Grade: 9-12 | Topics: Intersection points of circles and ellipses; graphical and algebraic solutions]
[Check here]
Problem 659: VAP- Exploring the Outer Atmosphere - Gas Density
Students estimate examine the density of gas in the Van Allen belts and use it to estimate how many atoms the Van Allen Probes will encounter.
[Grade: 6-8 | Topics: scientific notation; scale model; number = density x volume; volume = area x length; length=speed x time. ]
[Check here]
Problem 658: VAP- Exploring Gas Density in Space
Students explore how gas density is related to the average distances between molecules in the air using a simple geometric mode of a cube with 64 cells.
[Grade: 6-8 | Topics: geometry; density=number/volume; scale models and proportions; scientific notation ]
[Check here]
Problem 657: VAP- Exploring the Density of Gas in the Atmosphere
Students examine different ways to represent the density of Earths atmosphere.
[Grade: 6-8 | Topics: Scientific notation; density ]
[Check here]
Problem 656: VAP- Measuring Earths Magnetic Field in Space
Students work with satellite data to explore Earths magnetic field through graphing data and comparing it with inverse-square and inverse-cube laws.
[Grade: 9-12 | Topics: minimum and maximum; graphing data; comparing with models of the form 1/r2 and 1/r3 ]
[Check here]
Problem 655: VABP- Estimating the Total Mass of the Van Allen Belts
Students estimate the total mass of the van Allen Belts and compare it to the mass of a donut using the formula for a torus.
[Grade: 9-12 | Topics:Volume of torus; scientific notation; mass = density x volume ]
[Check here]
Problem 654: VABP- Exploring the Donut-shaped Van Allen Belts
Students estimate the volume of the van Allen Belts in terms of the volume of Earth using a formula for the volume of a torus.
[Grade: 9-12 | Topics: Scientific notation; volume of spheres and toriods]
[Check here]
Problem 653: VABP-How to Use the VABP Spacecraft to Measure the Mass of Earth!
Students use a formula to estimate the mass of Earth from data about the orbit of the Van Allen Probes spacecraft.
[Grade: 9-12 | Topics: scientific notation; solving formula with integer exponents ]
[Check here]
Problem 652: VABP- Telemetry Math
Students work with data rates for the spacecraft and determine how much data needs to be stored.
[Grade: 6-8 | Topics: megabytes; rates in time]
[Check here]
Problem 651: VABP- The Van Allen Belt Probes: Working with Octagons
Students work with the area formula for squares, rectangles and triangles to find the surface area of an octagonal satellite.
[Grade: 9-12 | Topics: areas of simple figures; algebraic manipulation]
[Check here]
Problem 650: VABP- Working with Areas of Rectangles and Circles
Students use the formulas for simple rectangle and circle areas to determine the areas of the holes in a satellite panel.
[Grade: 3-5 | Topics: area of a rectangle; area of a circle]
[Check here]
Problem 649: VABP- Electricity from Sunlight: The Van Allen Belt Probes Solar Panels
Students work with the area of rectangles to calculate the electrical power produced by solar panels.
[Grade: 3-5 | Topics: area of a rectangle; decimal math; unit conversion]
[Check here]
Problem 551:Giving Particles a Boost in the van Allen Belts
Students examine a ball bouncing down a flight of stairs and compare this to how van Allen particles gain their energy from numerous small boosts.
[Grade: 6-8 | Topics: equations; scientific notation]
[Check here]
Problem 506: A New Belt for the Van Allen Belts
Students use a model of the orbit of the van Allen Belts Probes and simulated data to draw the locations of the three van Allen Belts in space.
[Grade: 3-5 | Topics: Interpreting Tabular Data]
[Check here]
Problem 489: VAn Allen Belt Probes and the location of Dawn Chorus - III
The location of the Chorus signal from each of the Van Allen Belt Probes spacecraft is given by a linear equation that represents the direction along which the signal is detected by each spacecraft. Students solve the two linear equations for the common intersection point representing the location of the Chorus signal in space. This can be done graphically by plotting each linear equation, or solved algebraically.
[Grade: 6-8 | Topics: Linear equations; solving systems of equations; graphical solutions ]
[Check here]
Problem 488: Van Allen Belt Probes and the Location of Dawn Chorus - II
Students use hypothetical information from the twin RBSP spacecraft to triangulate the location of the Chorus signal near Earth using angle measurements, graphing and protractors to identify the intersection point of the CHorus signals.
[Grade: 6-8 | Topics: Angles; graphing; protractors ]
[Check here]
Problem 486: Van Allen Belt Probes Hear Dawn Chorus - I
Students explore the method of triangulation and how it might be used by the Van Allen Belt Probes spacecraft to find the origin of the Chorus signals.
[Grade: 6-8 | Topics: Graphing on the Cartesian plane; distances between points. ]
[Check here]
Problem 204: The Mass of the Van Allen Radiation Belts-
Students graph some magnetic field lines in polar coordinates, then estimate the volume and mass of the Belts using the formula for a torus.
[Grade: 9-12| Topics: Algebra II.]
[Check here]
Problem 93
An Introduction to Radiation Shielding -
Students calculate how much shielding a new satellite needs
to replace the ISO research satellite. Students use a graph of the wall thickness versus
dosage, and determine
how thick the walls of a hollow cubical satellite have to be to blackuce the
radiation exposure of its
electronics. Students calculate the mass of the satellite and
the cost savings by using different
shielding.
[Grade level: 9-11 | Topics: Algebra; Volume of a hollow cube; unit conversion]
[Check here]
Problem 71
Are the Van Allen Belts Really Deadly? -
This problem explores the radiation dosages that astronauts would receive as they travel
through the van Allen Belts enroute to the Moon. Students will use data to calculate the duration of the trip through the belts, and the total received dosage, and compare this to a lethal dosage to
confront a misconception that Apollo astronauts would have instantly died on their trip to the Moon.
[Grade level: 8-10 | Topics: decimals, area of rectangle, graph analysis]
[Check here]
Problem 422: Supercomputers: Getting the job done FAST!
Students use a simple counting problem to explore how much faster a supercomputer is compared to as hand-calculation.
[Grade: 6-8 | Topics: algebra]
[Check here]
Problem 418: Supercomputers: Modeling colliding neutron stars!
Students use a series of time-lapse images calculated using a supercomputer to determine the speed of collision of two neutron stars, and whether they will form a black hole afterwards.
[Grade: 8-10 | Topics: distance=speed x time; scale model; triangle and circle geometry; circumference]
[Check here]
Problem 407: Cryo-testing the Webb Space Telecope ISIM
Students explore scaling by creating an enlarged geometric model of the ISIM to better
appreciate the small changes due to expansion and contraction
[Grade: 6-8 | Topics: scale models; proportions; unit conversion]
[Check here]
Problem 381: The Cosmological Redshift - Changing the light from a galaxy.
Students learn about the redshift unit of measurement in astronomy, and solve a simple linear equation to explore
how the light from very distant galaxies is reddened compared to nearby galaxies.
[Grade: 8-10 | Topics: solving a simple equation for X]
[Check here]
Problem 380: Seeing the Distant Universe Clearly
Students calculate the angular sizes and scales of distant objects to study how different sized
telescopes see details with varying degrees of clarity.
[Grade: 7-9 | Topics: solving a simple equation for X; angular measure; Scientific Notation]
[Check here]
Problem 379: Exploring the Cosmos with Supercomputers
Students use two images created by a supercomputer calculation to explore the size and accuracy of computer models of the distanct universe.
[Grade: 7-9 | Topics: scale model; proportions; Scientific Notation]
[Check here]
Problem 370: 6-fold Symmetry and the Webb Space Telescope Mirror
Students learn about the Webb Space Telescopes segmented mirror and its rotational 6-fold symmetry due to tiling with hexagons.
They identify groups of tiles that have identical optical properties
[Grade: 8-10 | Topics: Properties of Hexagons; rotation symmetry; counting; tiling]
[Check here]
Problem 369: Scaling Up the Webb Space Telescope Mirror
Students learn about the Webb Space Telescopes segmented mirror and determine the area of the mirror along with scaled up
versions of this mirror using the formula for the area of a hexagon, and the properties of tiling a surface with hexagons.
[Grade: 8-10 | Topics: Properties of Hexagons and triangles; counting; evaluating a formula; tiling]
[Check here]
Problem 368: The Hexagonal Tiles in the Webb Space Telescope Mirror
Students learn about the Webb Space Telescopes segmented mirror by studying the geometry of hexagons.
[Grade: 8-10 | Topics: Properties of Hexagons and triangles; counting]
[Check here]
[Check here]
Problem 331: Webb Space Telescope: Detecting dwarf planets
The 'JWST' will be launched some time in 2014. One of its research goals will be to detect new dwarf planets beyond the orbit of Pluto.
In this problem, students use three functions to predict how far from the sun a body such as Pluto could be detected, by calculating
its temperature and the amount of infrared light it emits.
[Grade: 9-12 | Topics: Evaluating square-roots and base-e exponentials]
Problem 329: WISE and Hubble: Power Functions: A question of magnitude
Students explore the function F(x) = 10^-ax and learn about the stellar magnitude scale used by astronomers to rank the brightness of stars.
[Grade: 10-12 | Topics: base-10, evaluating power functions ]
[Check here]
Problem 328: WISE: F(x)G(x): A Tale of Two Functions
Students use WISE satellite data to study a practical application of the product of two functions by graphing them individually, and their product.
A calculus-level problem is included for advanced students.
[Grade: 10-12 | Topics: Power-law functions; domain and range; graphing; areas under curves; integration]
[Check here]
Problem 327: WISE: Exploring Power-law Functions Using WISE Data
Based on a recent press release of the 'First Light' image taken with NASA's new WISE satellite,
students explore a practical application of a power law function to count the number of stars in the sky.
An additional calculus-level problem is included for advanced students.
[Grade: 10-12 | Topics: areas; functions; histograms; unit conversion; power-laws; integration]
[Check here]
Problem 510: Planck Mission Sees the Ancient Universe Clearly
Students work with an image of the universe when it was 370,000 years old and determine from simple scaling and
proportions the sizes of the features seen in the image compared to the Milky Way.
[Grade: 6-8 | Topics: scale and proportion; angular measure]
[Check here]
Problem 233: The Milky Way: A mere cloud in the cosmos-
Students compare the average density of the Milky Way with the density of the universe.
[Grade: 8-10 | Topics: Volume of disk, density, scientific notation]
[Check here]
Problem 192: The Big Bang - Cosmic Expansion -
Students explore the expansion of the universe predicted by Big Bang cosmology
[Grade: 10-12| Topics: Algebra, Integral Calculus]
[Check here]
Problem 136 : Energy Generation near Black Holes
Students explore how much energy is generated by stars
and gas falling into black holes. The event horizon radius is calculated from a
simple equation, R = 2.95 M, and energy is estimated from E = mc^2.
[Grade: 7 - 10 | Topics:Scientific Notation; Working with equations in one variable to first and second power.]
[Check here]
Advanced Composition Explorer (ACE)
Cassini - Huygens
Chandra X-Ray Observatory
Dawn
Deep Impact - EPOXI
Fermi Gamma-Ray Observatory
Galaxy Evolution Explorer (GALEX)
Grail Ebb and Flo - Mapping lunar gravity
Gravity Probe - B (GP-B)
Hinode Solar Observatory
Hubble Space Telescope
Interstellar Boundary Explorer (IBEX)
Imager for Magnetosphere to Auroral Global Exploration (IMAGE)
InSight Seismographic Station on Mars
Juno to Jupiter
Kepler Exoplanet Transit Explorer
Lunar Atmosphere and Dust Environment Explorer
Landsat
Lunar Orbiter
Lunar Reconnissance Orbiter (LRO)
Manned Space Programs - Apollo, ISS, Shuttle, Ares, SpaceX
Magnetosphere Multi-Scale Mission (MMS)
Mars Science Lab and Curiosity Rover
Mars Rovers, Orbiters, etc.
Mercury Surface, Space Environment, Geochemistry, and Ranging (MESSENGER)
Near Earth Asteroid Rendezvous (NEAR)
New Horizons Mission to Pluto
Ramaty High Energy Solar Spectroscopic Imager (RHESSI)
Students Cloud Observations Online program
SAGE-III
Solar and Heliospheric Observatory (SOHO)
Solar Dynamics Observatory (SDO)
Parker Solar Probe
Spitzer Space Telescope
Solar Terrestrial Relations Observatory (STEREO)
Terra, Landsat, UARS, Earth Observatory
Time History of Events and Macroscale Interactions during Substorms (THEMIS)
Transition Region and Coronal Explorer (TRACE)
Van Allen Belt Probes (VABP)
Webb Space Telescope
Wide-Field Infrared Survey Explorer (WISE)
Wilkinson Microwave Anisotropy Probe (WMAP) and Planck
X-ray Multi-Mirror mission (XMM)
NASA’s STEAM Innovation Lab is a think tank with an emphasis on space science content applications.
Supporting Mission Education Pages
Astrophysics:
- Chandra - Click here
- Kepler - Click here
- James Webb ST - Click here
Earth Science:
- SAGE-III - Click here
- History of Winter- Click here
- S'COOL- Click here
Heliophysics:
- Hinode - Click here
- IMAGE - Click here
- MMS - Click here
- Stanford Solar Center - Click here
- Sun-Earth Day - Click here
- Van Allen Probes - Click here
- THEMIS - Click here
Planetary:
- Cassini - Click here
- Dawn - Mission Math
- EPOXI - Click here
- Eyes on the Solar System - Click here
- InSight - Click here
- Juno - Click here
- Solar System Exploration - Click here
Participating NASA Missions
- Deep Impact
- GALEX
- Gravity Probe-B
- Hubble Space Telescope
- Interstellar Boundary Explorer
- International Space Station (ISS)
- Landsat
- Lunar Reconnaissance Orbiter
- Mars Orbiter, Rovers, etc
- MESSENGER
- NEAR
- Planck
- RHESSI
- Solar and Heliospheric Obs.
- Solar Dynamics Observatory
- Space Transport. System Guide
- Parker Solar Probe
- Spitzer Infrared Observatory
- STEREO
- Wide-field IR Survey Explorer
- WMAP
Program Links