Books from SpaceMath
Multi-Media STEM Modules - Grades 6, 7 and 8: Standards-based, multi-media math resources featuring NASA eClips video segments, readings from NASA
press releases, online interactive resources, and of course math problems!
[Click here]
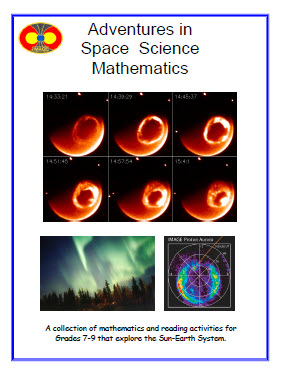
Adventures in Space Science Mathematics - 15 Problems - This series of math activities will help students understand some of the real life applications of mathematics in the study of the Sun and Earth as a system. Through math and reading activities, students will learn: How to search for trends and correlations in data; extract the average, maximum and minimum from data; use scientific notation to work with very large and small numbers; use a scale drawing to estimate the sizes of an aurora; use the Pythagorean Theorem to calculate magnetic field strength; and how to use simple equations to convert raw data into physical quantities [Click here]
Math problems for grades 6 to 7
Quick Navigation - click on the links below to jump to related math problems in this archive.
Properties of Numbers, Fractions, Decimals, Percentage, Scientific Notation, Unit Conversion |
Graphs, Graphical Analysis and Rates |
Working with Equations and Formulae |
Geometry |
Measurement |
Data Analysis and Probability |
Problem Solving
Problem 587: Comet Encounters after Discovery
Problem 586: Searching for Comets
Problem 556:IRIS Explores the Solar Transition Region
Problem 555:Exploring Your Weight Across the Solar System
Problem 545:Measuring Atmospheric Trace Gases Using Parts Per Million
Problem 544:The Composition of Planetary Atmospheres
Problem 539:Visiting the Planets at the Speed of Light
Problem 538:How Big is Our Solar System?
Problem 493: Fun with Gears and Fractions
Problem 446: Arctic Ozone Hole Continues to Grow in 2011
Problem 444: Predicting the Transits of the Stars Kepler-16A and 16B from Tatooine - II
Problem 407: Cryo-testing the Webb Space Telecope ISIM
Students explore scaling by creating an enlarged geometric model of the ISIM to better
appreciate the small changes due to expansion and contraction
[Grade: 6-8 | Topics: scale models; proportions; unit conversion]
[Click here]
Problem 400: The Most Distant Objects in the Universe
Students use a table of the most distant known events and objects in the universe to create a timeline of the universe
soon after the Big Bang.
[Grade: 6-8 | Topics: Working with millions and billions; elapsed time]
[Click here]
Problem 399: A Galactic City in the Far Reaches of the Universe
Students work with an image of a distant cluster of galaxies to determine its scale compared to nearby galaxies.
[Grade: 6-8 | Topics: Scale; proportion; metric measurement; unit conversion]
[Click here]
Problem 398: The Crab Nebula - Exploring a pulsar up close!
Students work with a photograph to determine its scale and the time taken by light and matter to reach a specified distance from the pulsar.
[Grade: 6-8 | Topics: Scale drawings; unit conversion; distance = speed x time]
[Click here]
Problem 356: Calculating Molecular Mass
Problem 345: How many stars are there?
Problem 344: Hubble Spies an Asteroid - Yes it does move!
Problem 342: The Rate of Oil Leakage in the Gulf Oil Spill of 2010
Students use still images from a video of the oil emitted by the leaking British Petrolium oil well in the Gulf of Mexico to
estimate the rate of oil leakage in gallons per day.
[Grade: 6-8 | Topics: unit conversions; rates; image scale] [Click here]
Problem 341: Recent Events: A Perspective on Carbon Dioxide
Students compare the carbon dioxide generated by the 2010 Icelandic volcano and the Gulf Oil Spill to see the relative contributions to the atmosphere of a natural and man-made catastrophe.
[Grade: 6-8 | Topics: unit conversions; rates ] [Click here]
Problem 339: Terra Satellite Spies the Great Gulf Oil Catastrophe of 2010
Students use a Terra satellite image of the oil slick in the Gulf of Mexico to calculate its area, mass and thickness.
[Grade: 6-8 | Topics: image scales; area of a circle; metric conversions ] [Click here]
Problem 337: SDO Reveals Details on the Surface of the Sun
Students use a spectacular colored image of the Sun to calculate the scale of the image in kilometers per millimeter, and then
search for the smallest features relative to the size of Earth.
[Grade: 6-8 | Topics: image scales; proportions] [Click here]
Problem 334: Solar Dynamics Observatory: Working with Giga, Tera, Peta and Exabytes
The recent launch of SDO will bring 'high definition TV' to the study of the sun's surface details. This also means a HUGE amount of data
will have to be processed every day to handle the torrent of information. This activity works with the prefixes
giga, tera, peta and exa to familiarize students with how to interpret these quantities in a practical setting. Students already know about 'gigabytes', but
the SDO data stream represents terabytes per day, and petabytes per year in data storage demands.
[Grade: 8-12 | Topics: powers of ten; time conversion: seconds, minutes, days, years] [Click here]
Problem 316: Counting Craters on the Hubble Space Telescope
Students count craters on a piece of the Wide Field Planetary
Camera recovered from the Hubble Space Telescope in 2009. They determine the cratering rate and use this to predict
how many impacts the solar panels on the International Space Station experiences each day.
[Grade: 6-9 | Topics: Counting; Area; density] [Click here]
Problem 315: The Mysterious Hexagon on Saturn
A curious hexagon formed by the Saturn polar jet stream, and photographed by the Cassini spacecraft, is
used to determine wind speed and acceleration.
[Grade: 6-9 | Topics: Measuring; Metric Units; speed=distance/time] [Click here]
Problem 314: Chandra Studies an Expanding Supernova Shell
Using a millimeter ruler and a sequence of images of a gaseous shell between 2000 and 2005,
students calculate the speed of the material ejected by Supernova 1987A.
[Grade: 6-9 | Topics: Measuring; Metric Units; speed=distance/time] [Click here]
Problem 301: Planetary Alignments
Students combine a geometric model with number series to calculate when planets will 'line up' in a simple solar system.
[Grade: 4-8 | Topics: Number series; geometry; Least Common Multiple] [Click here]
Problem 294: Star Cluster Math
A simple counting exercise involving star classes lets students work with percentages and ratios.
[Grade: 4-6 | Topics: Counting; percentage; scaling] [Click here]
Problem 289: Chandra Spies the Longest Sound Wave in the Universe
Students use an image of sound waves produced by a massive black hole to determine wavelength, and comparisons with
musical scale to find how many octaves this sound wave is below the wavelength of middle-C.
[Grade: 6-8 | Topics: metric measurement; scaling; Scientific Notation; exponents] [Click here]
Problem 273: IBEX Creates an Unusual Image of the Sky!
Students create an image of the sky by using a Bingo-like technique of tallying particles in
various sky directions using a simple 5x5 grid.
[Grade: 6-8 | Topics: Counting, tallying] [Click here]
Problem 262: LRO Explores Lunar Surface Cratering
Students count the number of craters in various size ranges from a high-resolution image of the lunar surface.
[Grade: 6-8 | Topics: scale, proportion, ratio, area, density] [Click here]
Problem 261: LRO - Searching for Lunar Boulders
Students use a recent image of the Apollo-11 landing area to search for large lunar boulders.
[Grade: 6-8 | Topics: scale, ratio, proportion] [Click here]
Problem 260: Some Famous Unit Conversion Errors
Students examine three famous unit conversion errors that led to catastrophic failures and near-death experiences.
[Grade: 6-8 | Topics: unit conversion, metric measure] [Click here]
Problem 301: Planetary Alignments
Students combine a geometric model with number series to calculate when planets will 'line up' in a simple solar system.
[Grade: 4-8 | Topics: Number series; geometry; Least Common Multiple] [Click here]
Problem 300: Does Anybody Really Know What Time It Is?
Students use tabulated data for the number of days in a year from 900 million years ago to the present, to estimate
the rate at which an Earth day has changed using a linear model.
[Grade: 4-8 | Topics: Graphing; Finding Slopes; forecasting] [Click here]
Problem 297: Atoms - How Sweet They Are!
A simple counting activity is based on atoms in a sugar molecule. Students calculate ratios and percantages
of various atomic types in the molecule.
[Grade: 4-8 | Topics: Counting; Ratios; percentage] [Click here]
Problem 273: IBEX Creates an Unusual Image of the Sky!
Students create an image of the sky by using a Bingo-like technique of tallying particles in
various sky directions using a simple 5x5 grid.
[Grade: 6-8 | Topics: Counting, tallying] [Click here]
Problem 267: Identifying Materials by their Reflectitity
The reflectivity of a material can be used to identify it. This is important when surveying the lunar surface for
minerals, and also in creating 'green' living environments on Earth.
[Grade: 6-8 | Topics: percentage, interpreting tabular data, area ] [Click here]
Problem 260: Some Famous Unit Conversion Errors
Students examine three famous unit conversion errors that led to catastrophic failures and near-death experiences.
[Grade: 6-8 | Topics: unit conversion, metric measure] [Click here]
Problem 251: Energy at Home
Students explore watts and kilowatt-hours as measures of energy and energy consumption.
[Grade: 6-8 | Topics: unit conversions; use of kilo and mega] [Click here]
Problem 253: NASA 'Sees' Carbon Dioxide
A satellite image of atmospheric carbon dioxide is used to estimate the geographic differences and identify human activity.
[Grade: 6-8 | Topics: interpreting a data image, unit conversion, gigatons ] [Click here]
Problem 252: Carbon Dioxide Increases
Students study the Keeling Curve to determine the rates of increase of carbon dioxide in the atmosphere.
[Grade: 6-8 | Topics: graph analysis, slope, rates, unit conversion, parts-per-million, gigatons] [Click here]
Problem 251: Energy at Home
Students explore watts and kilowatt-hours as measures of energy and energy consumption.
[Grade: 6-8 | Topics: unit conversions; use of kilo and mega] [Click here]
Problem 244: Solar Storms - Fractions and Percentages
Students create a Venn Diagram to summarize data on a series of solar storms, and determine how often solar flares occur
when a solar plasma eruption happens.
[Grade: 4-7 | Topics: precentages; Venn Diagramming] [Click here]
Problem 235: Scientific Data: The gift that keeps on giving!
Students learn about gigabytes and terabytes of data and the rates of data generation by NASA missions and how to store it.
[Grade: 6-8 | Topics: metric units; rates; money] [Click here]
Problem 234: The Hand of Chandra
Students use an image from the Chandra Observatory to measure a pulsar ejecting a cloud of gas.
[Grade: 6-8 | Topics: Scientific Notation; proportions; angle measure] [Click here]
Problem 231: Star Magnitudes and Decimals-
Students work with the stellar magnitude scale to determine the brightness differences between stars.
[Grade: 5-8 | Topics: Multiplying decimals.] [Click here]
Problem 195: Unit Conversions III-
Students work with more unit conversions and use them to solve a series of practical problems in science and solar energy.
[Grade: 6-10| Topics: unit conversions.] [Click here]
Problem 171: Are U Really Nuts?-
Students work with four unit conversion problems that are a bit tricky!
[Grade: 6-8 | Topics: unit conversions] [Click here]
Problem 123
A Trillion Here...A Trillion There
Students learn to work with large numbers, which are the heart and soul of
astronomical dimensions of size and scale. This activity explores the number 'one trillion' using examples drawn from
the economics of the United States and the World. Surprisingly, there are not many astronomical numbers commonly in use that are as big as a trillion.
[Grade: 5-9 | Topics:add, subtract, multiply, divide.] [Click here]
Problem 111
Scientific Notation III
In this continuation of the review of Scientific Notation,
students will perform simple multiplication and division problems with an astronomy and space science
focus.
[Grade: 5-9 | Topics:Scientific notation - multiplication and division] [Click here]
Problem 110
Scientific Notation II
In this continuation of the review of Scientific Notation,
students will perform simple addition and subtraction problems.
[Grade: 5-9 | Topics:Scientific notation - addition and subtraction] [Click here]
Problem 109
Scientific Notation I
Scientists use scientific notation to
represent very big and very small numbers. In this
exercise, students will convert some 'astronomical' numbers into scientific notation form.
[Grade: 5-9 | Topics:Scientific notation - conversion from decimal to SN] [Click here]
Problem 108
A Problem in Satellite Synchrony
The THEMIS program uses five satellites in five different
orbits to study Earth's magnetic field
and its changes during a storm. This problem asks students to use the periods of the
five satellites to figure out
when all 5 satellites will be lined-up
as seen from Earth. They will do this by finding the Greatest Common Multiple of the
five orbit periods, first for the case of 2 or 3 satellites, which can be easily
diagrammed with concentric circles,
then the case for all five satellites together.
[Grade: 5-9 | Topics:multiplication; Greatest Common Multiple] [Click here]
Problem 105
The Transit of Mercury
As seen from Earth, the planet Mercury occasionally passes
across the face of the sun; an event that astronomers call a transit. From images taken by the
Hinode satellite, students will create a model of the solar disk to the same scale as the
image, and calculate the distance to the sun.
[Grade: 9-11 | Topics:image scales; angular measure; degrees, minutes and seconds] [Click here]
Problem 94
Solar Storms: Odds, Fractions and Percentages -
Students will use actual data on solar storms to learn
about the
different kinds of storms and how common they are. This is a basic science activity that
professionals do in order to look for relationships between different kinds of events
that might
lead to clues about what causes them. Can your students come up with something new that
noone has thought about before? The Venn Diagramming activity is a key element of the activity and is reasonably challenging!
[Grade level: 6-8 | Topics: Averaging; fractions; percentages; odds; Arithmetic Operations; Venn Diagrams] [Click here]
Problem 82
Unit Conversions -
Students will use a number of obscure English units measures to convert from metric to English units and back, and answer some
unusual questions!
[Grade level: 6-8 | Topics: arithmetic; unit conversions involving 1 to 5 steps) ] [Click here]
Problem 67
Unit Conversion Exercises -
Radiation dosages and exposure calculations allow students to
compare several different ways that scientists use to compare how radiation exposure is delivered
and accumulated over time.Like converting 'centimeters per sec' to 'kilometers per year' ,this
activity reinforces student Topics in converting from one set of units to another.
[Grade level: 6-8 | Topics: fractions, decimals, units] [Click here]
Problem 64
Solar Activity and Satellite Mathematics -
When solar storms cause satellite problems, they can also cause satellites to lose money.
The biggest source of revenue from communications satellites comes from transponders that relay television programs, ATM
transactions and many other vital forms of information. They are rented to many different customers and can cost nearly
$2 million a year for each transponder. This activity examines what happens to a single satellite when space weather
turns bad! [Grade level: 4-6 | Topics: Decimals; money; percents] [Click here]
Problem 58
How many stars are there? -
For thousands of years, astronomers have counted the stars to
determine just how vast the heavens are. Since the 19th century, 'star gauging' has been
an important
tool for astronomers to assess how the various populations of stars are distributed within
the Milky Way. In this activity, students will get their first taste of star counting by
using a star atlas reproduction and bar-graph the numbers of stars in each magnitude interval.
They will then calculate the number of similar stars in the sky by scaling up their counts to the full
sky area.
[Grade level: 6-8 | Topics: Positive and negative numbers; histogramming; extrapolating data] [Click here]
Problem 48
Scientific Notation - An Astronomical Perspective. -
Astronomers use scientific notation because the numbers they work with are usually..astronomical in size. This
collection of problems will have students reviewing how to perform multiplication and division with large and small numbers, while
learning about some interesting astronomical applications. They will learn about the planet Osiris, how long it takes to
download all of
NASA's data archive, the time lag for radio signals to Pluto, and many more real-world applications.
[Grade level: 8-10 | Topics: Scientific notation; decimal math] [Click here]
Problem 47
Discovering the Milky Way by Counting Stars. -
It is common to say that there are about 8,000 stars visible to the naked eye in
both hemispheres of the sky, although from a typical urban setting, fewer
than 500 stars are actually visible. Students will use data from a deep-integration image of a
region of the sky in Hercules, observed by the 2MASS sky survey project to estimate the number
of stars in the sky. This number is a lower-limit to the roughly 250 to 500 billion stars that
may actually exist in the Milky Way.
[Grade level: 4-6 | Topics: Tallying data; decimal math] [Click here]
Problem 39
Solar Storm Timeline
How long does a solar storm last? How fast does it travel? Students will examine
an event timeline for a space weather event and use time addition and subtraction skills to
calculate storm durations and speeds. [Grade level: 7-9 | Topics: time math; decimal math; speed = distance/time] [Click here]
Jump to Top of Page
Problem 577: Designing a Telescope System
Problem 566:Exploring Light Brightness and the Inverse Square Law
Problem 563:Comet ISON and its Close Encounter with Mars
Problem 562:Exploring the Orbit of Comet ISON
Problem 560:The Orbit of Comet ISON
Problem 558:How Quickly are NEOs Being Discovered?
Problem 557:The 10000th Near Earth Asteroid 2013 MZ5
Problem 541:How to Build a Planet
Problem 486: RBSP Hears Dawn Chorus - I
Problem 471: Investigating the Launch of the Juno Spacecraft
Problem 470: The Launch of the Juno Spacecraft - Ascent to orbit
Problem 459: A piece of history - space shuttle thermal tiles
Problem 453: The Closest Approach of Asteroid 2005YU55 - II
Problem 408: Estimating the Speed of a Tsunami
Students use the tsunami arrival times and earthquake start time for the devastating 2011 Japan
Earthquake to estimate the speed of a tsunami as it crosses the Pacific Ocean to make landfall in Hawaii and California.
[Grade: 6-8 | Topics: Time arithmetic; time zones; speed = distance/time]
[Click here]
Problem 405: Discovering Earth-like Worlds by their Color
Students use recent measurements of the reflected light from solar system bodies to graph their colors and to use this in
classifying new planets as Earth-like, moon-like or Jupiter-liike
[Grade: 6-8 | Topics: graphing tabular data; interpreting graphical data]
[Click here]
Problem 395: Death Stars
Some stars create super-flares that are capable of eliminating life on planets that orbit close to the star. Students learn about
these flares on common red-dwarf stars and compare them to flares on our own sun
[Grade: 6-9 | Topics: Scientific Notation; percentages; rates of change]
[Click here]
Problem 393: Taking a stroll around a martian crater!
Students use a recent photograph of a crater on Mars to estimate its circumference and the time it will take NASAs Opportunity Rover to travel once around its edge.
[Grade: 6-8 | Topics: scale model; distance = speedxtime; metric measure]
[Click here]
Problem 386: Whacky Spacecraft Orbits - They only seem crazy!
Problem 384: Detecting the Most Distant SUpernova in the Universe
Problem 358: A Flyby of Asteroid Lutetia
Problem 355: Astronaut Bone Loss
Problem 354: Earth's Polar Wander - The Chandler Wobble
Problem 325: Kepler Spies Five New Planets
Students count squares on a Bizarro Star to study the transit of a planet, and determine the diameter of the planet.
This demonstrates the basic principle used by NASA's Kepler satellite to search for Earth-sized planets orbiting distant stars.
[Grade: 4-6 | Topics: Counting; graphing; area of a square] [Click here]
Problem 300: Earth's Rotation Changes and the Length of the Day?
Students use tabulated data for the number of days in a year from 900 million years ago to the present, to estimate
the rate at which an Earth day has changed using a linear model.
[Grade: 4-8 | Topics: Graphing; Finding Slopes; forecasting] [Click here]
Problem 100
The Sunspot Cycle - endings and beginnings -
Students will examine a plot of the sunspot cycle and extract information from the plotted data about
the previous sunspot cycle, and make predictions about the next one about to start in 2007.
[Grade level: 6-9 | Topics:graph reading; extrapolation; time calculations] [Click here]
Problem 90
A Career in Astronomy -
This problem looks at some of the statistics of working in a field like astronomy. Students will read graphs and answer questions about
the number of astronomers in this job area, and the rate of increase in the population size
and number of advanced degrees.
[Grade level: 6-8 | Topics: graph reading; percentages; interpolation] [Click here]
Problem 227: Working With Rates-
Students examine mixed rates for a variety of situations and their connections to ratios.
[Grade: 6-8 | Topics: Ratios; scientific notation; unit conversion.] [Click here]
Problem 226: Rates and Slopes: An astronomical perspective-
Students determine the slopes for two linear graphs and make the connection to rates with mixed units.
[Grade: 7-9 | Topics: Finding the slope of a linear graph.] [Click here]
Problem 225: Areas Under Curves; An astronomical perspective-
Students work with a bar graph of the number of planet discoveries since 1995 to evaluate the total
discoveries, as areas under the graph, for various combinations of time periods.
[Grade: 6-8 | Topics: Adding areas in bar graphs.] [Click here]
Problem 100
The Sunspot Cycle - endings and beginnings -
Students will examine a plot of the sunspot cycle and extract information from the plotted data about
the previous sunspot cycle, and make predictions about the one that began in 2007 called Cycle 24.
[Grade level: 6-9 | Topics:graph reading; extrapolation; time calculations] [Click here]
Jump to Top of Page
Problem 585: Exploring Comet Orbits
Problem 583: Buying a Telescope
Problem 580: Measuring Gravity with a Pendulum
Problem 574: Telescope Light Gathering Ability - Seeing Faint Stars
Problem 573: Calculating the Magnification of a Telescope
Problem 571: Focal Lengths, Apertures and F/numbers
Problem 569: Orbit Speeds and Times for Saturns Rings
Problem 568: Ios Volcanoes and Resurfacing
Problem 561:Exploring the Evaporating Exoplanet HD189733b
Problem 559:Comet ISON Losing Mass as it Approaches the Sun.
Problem 554:Exploring Volcanoes and Geysers Across the Solar System
Problem 551:Giving Particles a Boost in the van Allen Belts
Problem 540:Travel Times by Spacecraft Around the Solar System
Problem 498: The Slope of a Magnetic Field Line
Problem 497: Graphing a Magnetic Field Line
Problem 489: RBSP and the location of Dawn Chorus - III
Problem 480: The Expanding Gas Shell of U Camelopardalis
Problem 425: Exploring a Full-sized Black Hole
Problem 422: Supercomputers: Getting the job done FAST!
Students use a simple counting problem to explore how much faster a supercomputer is compared to as hand-calculation.
[Grade: 6-8 | Topics: algebra]
[Click here]
Problem 419: The Space Shuttle: Fly me to the moon?
Students discuss the popular misconception that the Space Shuttle can travel to the moon by examining the required orbit speed change and the capacity of the Shuttle engines to provide the necessary speed changes.
[Grade: 6-8 | Topics: amount = rate x time ]
[Click here]
Problem 412: Radiation Dose and Dose Rate
Students use radiation measurements across Japan to calculate the total absorbed doses from the 2011 nuclear reactor failures. They also
calculate the total dose for passenger trips on jets and the Concorde.
[Grade: 6-8 | Topics: unit conversions; amount=rate x time]
[Click here]
Problem 411: Lifestyles and Radiation Dose
Students see how the kind of lifestyle you lead determines most of your annual absorbed radiation dose.
Some factors are under your control, and some are not.
[Grade: 6-8 | Topics: unit conversions; amount=rate x time]
[Click here]
Problem 410:Exploring Radiation in your Life
Students use a pie grap to calculate the total dose and dose rate for various factors that determine your annual radiation exposure while living on Earth.
[Grade: 6-8 | Topics: unit conversions; amount=rate x time]
[Click here]
Problem 391: Investigating the atmosphere of Super-Earth GJ-1214b
Students investigate a simple model for the interior of an exoplanet to estimate the thickness of its atmosphere
given the mass size and density of the planet.
[Grade: 6-8 | Topics: graphing functions; evaluating functions for given values; volume of a sphere; mass = densityxvolume]
[Click here]
Problem 389: Estimating the diameter of the SN1979c black hole
Students use simple equations to learn about the various definitions for the sizes of black holes in terms of their event horizons, last photon orbit, and last stable particle orbit radii, and apply this to the recently discovered 'baby' black hole in the galaxy M-100
[Grade: 6-8 | Topics: evaluating linear functions; integer math; metric units]
[Click here]
Problem 380: Seeing the Distant Universe Clearly
Problem 357: The Fastest Sea Level Rise in the United States
Problem 222: Kelvin Temperatures and Very Cold Things-
Students convert from Celsius to Fahrenheit and to Kelvin using three linear equations.
[Grade: 5-8 | Topics: Evaluating simple linear equations for given values] [Click here]
Problem 221: Pulsars and Simple Equations-
Students work with linear equations describing the rotation period of a pulsar, and evaluate the
equations for various conditions. Students use the equations to predict intersection points in time.
[Grade: 6-8 | Topics: Evaluating simple one-variable equations] [Click here]
Problem 219: Variables and Expressions from Around the Cosmos-
Students evaluate linear equations describing a variety of astronomical situations.
[Grade: 6-8 | Topics: Evaluating simple one-variable equations.] [Click here]
Problem 206: Can You Hear me now? -
Students learn about how the transmission of data is affected by how far away a satellite is, for a variety of spacecraft in the solar system
[Grade: 6-8| Topics: multiplication; division; decimal numbers.] [Click here]
Problem 209: How to make faint things stand out in a bright world!-
Students learn that adding images together often enhances faint things not seen in only one image; the power of averaging data.
[Grade: 6-8| Topics: multiplication; division; decimal numbers.] [Click here]
Problem 203: Light Travel Times-
Students determine the time it takes light to reach various objects in space.
[Grade: 6-8| Topics: Scientific Notation; Multiplication; time = distance/speed.] [Click here]
Problem 164: Equations with One Variable-
Students work with equations like '4.3 = 3.26D' to solve for D in a number of simple astronomical problems involving distances, speed and temperature conversion.
[Grade: 6-8 | Topics: equations in one variable; multiplication; division; decimals] [Click here]
Problem 61
Drake's Equation and the Search for Life...sort of! -
Way back in the 1960's Astronomer Frank Drake invented an equation
that helps us estimate how much life, especially the intelligent kind, might exist in our Milky Way. It has
been a lively topic of discussion in thousands of college astronomy courses for the last 30 years. In this simplified version,
your students will get to review what we now know about the planetary universe, and come up with their own
estimates. The real fun is in doing the research to track down plausible values (or their ranges) for the factors that
enter into the equation, and then write a defense for the values that they choose. Lots of opportunity to summarize basic astronomical knowledge towards
the end of an astronomy course, or chapter.
[Grade level: 6-8 | Topics: decimal math; evaluating functions for given values of variables] [Click here]
Jump to Top of Page
Problem 579: The Scale of an Image with a Telescope
Problem 578: Digital Camera Math
Problem 576: Telescope Resolution - How much detail can you see?
Problem 575: Telescope Field of View - How much can you see?
Problem 565:Mapping Earth from Space - Swaths and Coverage
Problem 550:Comparing the Rings of the Outer Planets
Problem 549:Saturns Rings- Shadows from Moons and Ringlets
Problem 542:The Late Heavy Bombardment Era
Problem 512: New NASA Satellite Takes Pictures of Salton Sea
Problem 510: Planck Mission Sees the Ancient Universe Clearly
Problem 509:Gail Spacecraft Creates a New Crater on the Moon
Problem 508: The InSight Seismographic Station - Wave arrival times
Problem 491: The Curiosity Rover on the Move.
Problem 490: LL Pegasi - A Perfect Spiral in Space
Problem 484: Exploring Water Use in Kansas
Problem 467: Estimating Magnetic Field Speeds on the Sun
Problem 463: A Simple Fuel Gauge in a Cylindrical Tank
Problem 461: Cassini Delivers Holiday Treats from Saturn
Problem 443: Predicting the Transits of the Stars Kepler-16A and 16B from Tatooine - I
Problem 440: LRO explores the Apollo 12 landing area on the moon
Problem 439: Chandra Sees a Distant Planet Evaporating
Problem 406: Growing Grapes in the Middle of the Desert
Students use a dramatic Earth Observatory-1 satellite image of agriculture in Namibia to estimate the total cultivated
area and water needs of grape growing under desert conditions
[Grade: 6-8 | Topics: areas of irregular regions; unit conversion]
[Click here]
Problem 379: Exploring the Cosmos with Supercomputers
Problem 378: LRO Makes a Temperature Map of the Lunar South Pole
Problem 360: Kepler's First Look at 700 Transiting Planets
Problem 335: Methane Lakes on Titan
Students use a recent Cassini radar image of the surface of Titan to estimate how much methane is present in the lakes that fill
the image, and compare the volume to that of the fresh water lake, Lake Tahoe.
[Grade: 6-8 | Topics: estimating irregular areas; calculating volume from area x height; scaled images ] [Click here]
Problem 258: LRO's First Image of Mare Nubium
Students examine the first image of this lunar region using the high-resolution camera image provided by the Lunar Reconnaissance Orbiter.
[Grade: 6-8 | Topics: scale, ratio, proportion] [Click here]
Problem 257: LRO and the Apollo-11 Landing Site
Students examine a map of the Apollo-11 landing area and determine how well various features
will be visible to the Lunar Reconnaissance Orbiter high-resolution camera.
[Grade: 6-8 | Topics: scale, proportion, ratios] [Click here]
Problem 256: A High-resolution Satellite Photo
Students examine a satellite photo of the Tennessee Court House from the GEO-1 satellite and determine the sizes of familiar features in the image.
[Grade: 6-8 | Topics: scale, ratios, proportions' angle measure, triangle geometry] [Click here]
Problem 255: Tempel-1 - Close-up of a Comet
Students examine an image of the Comet Tempel-1 taken by the Deep Impact spacecraft to determine feature sizes and other details.
[Grade: 6-8 | Topics: scales, proportions ] [Click here]
Problem 236: LRO Sees Apollo-11 on the Moon!
Students use the latest image from the Lunar Reconnaissance Orbiter of the Apollo-11 landing
site to explore lunar features at 1-meter resolution, and determine the solar elevation angle.
[Grade: 6-8 | Topics: scale; ratios; angle measure; right triangles] [Click here]
Problem 333: Hubble: Seeing a Dwarf Planet Clearly
Based on a recent press release, students use the published photos to determine the sizes of the smallest discernible features and compare them to the sizes of the 48-states in the USA.
They also estimate the density of Pluto and compare this to densities of familiar substances to create a 'model' of Pluto's composition.
A supplementary Inquiry Problem asks students to model the interior in terms of two
components and estimate what fraction of Pluto is composed of rock or ice.
[Grade: 8-12 | Topics: scales and ratios; volume of sphere; density=mass/volume] [Click here]
Problem 316: Counting Craters on the Hubble Space Telescope
Students count craters on a piece of the Wide Field Planetary
Camera recovered from the Hubble Space Telescope in 2009. They determine the cratering rate and use this to predict
how many impacts the solar panels on the International Space Station experiences each day.
[Grade: 6-9 | Topics: Counting; Area; density] [Click here]
Problem 299: Changing Perspectives on the Sun's Diameter
Students compare two images of the sun taken by the SHOH satellite to measure the apparent diameter
change from different earth obit locations in the winter and summer.
[Grade: 6-8 | Topics: measurement; parallax; metric units; percentage change] [Click here]
Problem 295: Details from an Exploding Star
Students work with an image from the Hubble Space Telescope of the Crab Nebula to calculate scales and sizes of various features.
[Grade: 6-9 | Topics: Scale; measurement; metric units] [Click here]
Problem 278: Spitzer Studies the Distant Planet Osiris
Students learn about the density of the planet HD209458b, also called Osiris, and compare it to that of Jupiter.
[Grade: 8-10 | Topics: Spherical volumes; density; Scientific Notation] [Click here]
Problem 275: Water on the Moon!
Students estimate the amount of water on the moon using data from Deep Impact/EPOXI and NASA's Moon Minerology Mapper experiment on the Chandrayaan-1 spacecraft.
[Grade: 8-10 | Topics: Geometry, Spherical volumes and surface areas, Scientific notation] [Click here]
Problem 272: Spitzer Telescope Discovers New Ring of Saturn!
Students calculate the volume of the ring and compare it to the volume of Earth to check a news release figure that
claims 1 billion Earths could fit inside the new ring.
[Grade: 8-9 | Topics: Geometry, Algebra, volumn, scientific notation] [Click here]
Problem 213: Kepler: The hunt for Earth-like planets-
Students compare the area of a star with the area of a planet to determine how the star's light
is dimmed when the planet passes across the star as viewed from Earth. This is the basis for the 'transit'
method used by NASA's Kepler satellite to detect new planets.
[Grade: 6-8 | Topics: Area of circle; ratios; percents.] [Click here]
Problem 197: Hubble Sees a Distant Planet-
Students study an image of the dust disk around the star Fomalhaunt and determine the orbit period and distance of a newly-discovered planet orbiting this young star.
[Grade: 6-10| Topics: Calculating image scales; Circle circumferences; Unit conversions; distance-speed-time] [Click here]
Problem 196: Angular Size and velocity-
Students study a spectacular photo of the ISS passing across the face of the sun, and work out the angular sizes and speeds of the transit to figure out how long the event took in order to photograph it.
[Grade: 8-10| Topics: Geometry; Angle measurement] [Click here]
Problem 177: Lunar Cratering: Probability and Odds-
Students work with crater counting to estimate the area coveblack by craters and how to convert this into impact probabilities.
[Grade: 4-7| Topics: Area; probability] [Click here]
Problem 118
An Application of the Parallax Effect
The STEREO mission views the sun from two different locations in space. By combining this data, the parallax
effect can be used to determine how far above the solar surface various active regions are located. Students use the Pythagorean Theorem, a bit of
geometry, and some actual STEREO data to estimate the height of Active Region AR-978.
[Grade: 8-10 | Topics:Pythagorean Theorem; square-root; solving for variables] [Click here]
Problem 103
The Mysterious Solar Micro-Flares!
Students will analyze an image taken by the Hinode
solar satellite to determine the scale of the image in kilometers per millimeter,
then use this to determine the sizes of solar micro-flares.
From the number of micro-flares that they count in the image,
the area of the image in square kilometers, and the surface area
of a spherical sun, they will calculate the total number
of micro-flares on the solar surface.
[Grade: 6-9 | Topics:image scales; area calculation; unit conversions] [Click here]
Problem 96
Hinode Satellite Power -
Students will study the design of the Hinode solar satellite and calculate how much power it can generate from its solar panels.
[Grade level: 6-8 | Topics:area of rectangle,area of cylinder, unit conversion] [Click here]
Problem 92
A Lunar Transit of the Sun from Space -
One of the STEREO satellites observed the disk of the moon pass across the sun. Students will use simple geometry to determine how far
the satellite was from the moon and Earth at the time the photograph was taken.
[Grade level: 8-10 | Topics: Geometry; parallax; arithmetic] [Click here]
Problem 60
When is a planet not a planet? -
In 2003, Dr. Michael Brown and his colleagues at CalTech discovered an object nearly 30% larger
than Pluto, which is designated as 2003UB313. It is also known unofficially as Xenia, after the famous TV warrior princess!
Is 2003UB313 really a planet? In this activity, students will examine
this topic by surveying various internet resources that attempt to define the astronomical term 'planet'.
How do astronomers actually assign names to astronomical objects? Does 2003UB313 deserve to be called a planet, or should it
be classified as something else? What would the new classification mean for asteroids such as Ceres, or objects
such as Sedna, Quaoar and Varuna?
[Grade level: 6-8 | Topics: Non-mathematical essay; reading to be informed] [Click here]
Problem 59
Getting A Round in the Solar System! -
How big does a body have to be before it becomes round? In this
activity, students examine images of asteroids and planetary moons to determine the critical
size for an object to become round under the action of its own gravitational field. Thanks to many Internet image archives
this activity can be expanded to include dozens of small bodies in the solar system to enlarge the
research data for this problem. Only a few example images are provided, but these are enough for
the student to get a rough answer!
[Grade level: 6-8 | Topics: Data analysis; decimals; ratios; graphing] [Click here]
Problem 38
Solar Eclipses and Satellite Power
From the ground we see total solar eclipses where
the New Moon passes directly between Earth and Sun. Satellites use solar
cells to generate electricity, but this is only possible when the Earth is
not 'eclipsing' the sun. Students will create a scaled drawing of the
orbits of three satellites around Earth, and calculate how long each
satellite will be in the shadow of Earth. They will be asked to figure out
how to keep the satellites operating even without sunlight to power their
solar panels. [Grade: 5 - 8 | Topics: Geometry; decimal math] [Click here]
Problem 23
Solar Flares and Sunspot Sizes
Students compare sunspot sizes to the frequency of
solar flares and discover that there is no hard and fast rule that relates
sunspot size to its ability to produce very large flares.
[Grade: 6 - 8 | Topics: Interpreting tabular data; percentages; decimal math ] [Click here]
Problem 16
Solar Power and Satellite Design
Students perform simple surface area calculations to
determine how much solar power a satellite can generate, compared to the
satellite's needs. [Grade: 6 - 8 | Topics: Area of irregular polygons] [Click here]
Problem 11
How high is an aurora?
Students use the properties of a triangle to
determine how high up aurora are. They also learn about the parallax
method for finding distances to remote objects.
[Grade: 5 - 8 | Topics: Geometery; angle measure] [Click here]
Problem 6
Observing the Sun's rotation
Students use a Sunspotter to track sunspots during
the week of November 7, 2004, and calculate the rotation period of the
sun. [Grade: 6 - 8 | Topics: Lab exercise using a 'Sunspotter' to measure sun's rotation] [Click here]
Problem 2
Satellite Surface Area
>Students calculate the surface area of an octagonal
cylinder and calculate the power it would yield from solar cells covering
its surface. [Grade: 7 - 9 | Topics: surface areas; hexagone; decimal math] [Click here]
Jump to Top of Page
Problem 315: The Mysterious Hexagon on Saturn
A curious hexagon formed by the Saturn polar jet stream, and photographed by the Cassini spacecraft, is
used to determine wind speed and acceleration.
[Grade: 6-9 | Topics: Measuring; Metric Units; speed=distance/time] [Click here]
Problem 314: Chandra Studies an Expanding Supernova Shell
Using a millimeter ruler and a sequence of images of a gaseous shell between 2000 and 2007,
students calculate the speed of the material ejected by Supernova 1987A.
[Grade: 6-9 | Topics: Measuring; Metric Units; speed=distance/time] [Click here]
Problem 299: Changing Perspectives on the Sun's Diameter
Students compare two images of the sun taken by the SHOH satellite to measure the apparent diameter
change from different earth obit locations in the winter and summer.
[Grade: 6-8 | Topics: measurement; parallax; metric units; percentage change] [Click here]
Problem 295: Details from an Exploding Star
Students work with an image from the Hubble Space Telescope of the Crab Nebula to calculate scales and sizes of various features.
[Grade: 6-9 | Topics: Scale; measurement; metric units] [Click here]
Problem 289: Chandra Spies the Longest Sound Wave in the Universe
Students use an image of sound waves produced by a massive black hole to determine wavelength, and comparisons with
musical scale to find how many octaves this sound wave is below the wavelength of middle-C.
[Grade: 6-8 | Topics: metric measurement; scaling; Scientific Notation; exponents] [Click here]
Problem 259: Mare Nubium And Las Vegas
Students compare two satellite images taken at the same resolution to appreciate how large lunar features are compared to more familiar objects.
[Grade: 6-8 | Topics: scale, proportion, ratio] [Click here]
Problem 258: LRO's First Image of Mare Nubium
Students examine the first image of this lunar region using the high-resolution camera image provided by the Lunar Reconnaissance Orbiter.
[Grade: 6-8 | Topics: scale, ratio, proportion] [Click here]
Problem 257: LRO and the APollo-11 Landing Site
Students examine a map of the Apollo-11 landing area and determine how well various features
will be visible to the Lunar Reconnaissance Orbiter high-resolution camera.
[Grade: 6-8 | Topics: scale, proportion, ratios] [Click here]
Problem 256: A High-resolution Satellite Photo
Students examine a satelite photo of the Tennessee Court House from the GEO-1 satellite and determine the sizes of familiar features in the image.
[Grade: 6-8 | Topics: scale, ratios, proportions' angle measure, triangle geometry] [Click here]
Problem 255: Temple-1 - Closeup of a Comet
Students examine an image of the Comet Temple-1 taken by the Dawn spacecraft to determine feature sizes and other details.
[Grade: 6-8 | Topics: scales, proportions ] [Click here]
Problem 240: The Eagle Nebula Close-up
Students measure a Hubble image of the famous Eagle Nebula 'Pillars of Creation' to determine the sizes of
various features compared to our solar system
[Grade: 6-8 | Topics: scale, proportion, angle measure] [Click here]
Problem 239: Counting Galaxies with the Hubble Space Telescope
Students use an image of a small area of the sky to estimate the total number of galaxies in the universe visible from Earth.
[Grade: 6-8 | Topics: area, angular measure] [Click here]
Problem 237: The Martian Dust Devils
Students determine the speed and acceleration of a martian dust devil from time laps images and information about the scale of the image.
[Grade: 6-8 | Topics: scales; Determining speed from sequential images; V = D/T] [Click here]
Problem 236: LRO Sees Apollo-11 on the Moon!
Students use the latest image from the Lunar Reconnaissance Orbiter of the Apollo-11 landing
site to explore lunar features at 1-meter resolution, and determine the solar elevation angle.
[Grade: 6-8 | Topics: scale; ratios; angle measure; right triangles] [Click here]
Problem 234: The Hand of Chandra
Students use an image from the Chandra Observatory to measure a pulsar ejecting a cloud of gas.
[Grade: 6-8 | Topics: Scientific Notation; proportions; angle measure] [Click here]
Problem 197: Hubble Sees a Distant Planet-
Students study an image of the dust disk around the star Fomalhaunt and determine the orbit period and distance of a newly-discovered planet orbiting this young star.
[Grade: 6-10| Topics: Calculating image scales; Circle circumferences; Unit conversions; distance-speed-time] [Click here]
Problem 196: Angular Size and velocity-
Students study a spectacular photo of the ISS passing across the face of the sun, and work out the angular sizes and speeds of the transit to figure out how long the event took in order to photograph it.
[Grade: 8-10| Topics: Geometry; Angle measurement] [Click here]
Problem 122
XZ Tauri's Super CME!
Ordinarily, the SOHO satellite and NASA's STEREO mission spot coronal
mass ejections (CMEs) but the Hubble Space Telescope has also spotted a few of its own...on distant stars! Students will
examine a sequence of images of the young star XZ Tauri, and measure the average
speed and density of this star's CME event between 1955 and 2000.
[Grade: 8-10 | Topics:Calculate image scale; speed
from distance and time; mass:volume:density] [Click here]
Problem 119
A Star Sheds a Comet Tail!
The GALEX satellite captured a spectacular image of the star Mira shedding a tail of gas and dust nearly
13 light years long. Students use the GALEX image to determine the speed of the star, and
to translate the tail structures into a timeline extending to 30,000 years ago.
[Grade: 8-10 | Topics:Image scaling; Unit conversion; Calculating speed from distance and time] [Click here]
Problem 116
The Comet Encke Tail Disruption Event
On April 20, 2007 NASA's STEREO satellite captured a rare
impact between a comet and the fast-moving gas in a solar coronal mass ejection. In this problem, students
analyze a STEREO satellite image to determine the speed of the tail disruption event.
[Grade: 8-10 | Topics:time calculation; finding image scale; calculating speed from distance and time] [Click here]
Problem 112
How fast does the sun spin?
Students will use two x-ray images of the sun taken by the Hinode satellite to determine how fast the sun rotates.
[Grade: 5-9 | Topics:calculating map scales; time calculations; unit conversion] [Click here]
Problem 107
Monster Sunspots!
Some sunspots are so big that they can be seen from Earth
without a telescope. In this
problem, students will use images of three super-spots and calculate their sizes from the
image scaling information. They will then order
the images from the smallest super-spot to the largest super-spot.
[Grade: 5-9 | Topics:multiplication; calculating length from image scale] [Click here]
Problem 105
The Transit of Mercury
As seen from Earth, the planet Mercury occasionally passes
across the face of the sun; an event that astronomers call a transit. From images taken by the
Hinode satellite, students will create a model of the solar disk to the same scale as the
image, and calculate the distance to the sun.
[Grade: 9-11 | Topics:image scales; angular measure; degrees, minutes and seconds] [Click here]
Problem 101
Super-Fast Solar Flares!! -
Students will analyze consecutive images taken of an erupting solar flare, and use
the information provided to calculate the speed of the flare.
[Grade level: 6-9 | Topics:image scales; time calculations; speed calculations] [Click here]
Problem 99
The Hinode Satellite Views the Sun -
Students will use a full-sun image from the new Hinode satellite
to sketch the locations of magnetic fields on the sun's surface using information in the introductory article as a guide.
[Grade level: 6-8 | Topics:image interpretation; eye-hand coordination; reading to be informed] [Click here]
Problem 97
Hinode - Closeup of a Sunspot -
Students will determine the sizes of sunspots and solar granulation cells from a recent image
taken by the Hinode solar observatory.
[Grade level: 6-8 | Topics:image scales, metric units, unit conversion] [Click here]
Problem 85
The Solar Tsunami! -
Recent data from the Hinode satellite is used
to measure the speed of a solar explosion on the surface of the sun using a
series of images taken by the satellite at three different times.
Students calculate the speed of the blast between the first pair and last pair of images, and determine if the
blast wave was accelerating or decellerating in time.
[Grade level: 5-8 | Topics: Finding image scale; calculating time differences; calculating speed from distance and time] [Click here]
Problem 78
Moving Magnetic Filaments Near Sunspots -
Students will use two images from the new, Hinode (Solar-B) solar observatory to calculate the speed of
magnetic filaments near a sunspot. The images show the locations of magnetic features at two different times. Students
calculate the image scales in kilometers/mm and determine the time difference to estimate the speeds of the selected
features.
[Grade level: 6-8 | Topics: scaling, estimation, speed calculations, time arithmetic ] [Click here]
Problem 63
Solar Activity and Tree Rings - What's the connection? -
Trees require sunlight to grow, and we know that solar
activity varies with the sunspot cycle. Can an average tree sense solar activity cycles and
change the way it grows from year to year? This activity uses a single tree to compare
its growth rings to the sunspot cycle. This is also an interesting suggestion for science fair
projects! Here is the accompanying Excel Spreadsheet Data File.
[Grade level: 4-6 | Topics: Spreadsheets and technology; decimal math] [Click here]
Problem 52
Measuring the size of a Star Cluster -
Astronomers often use a photograph to determine the size of astronomical objects. The
Pleiades is a famous cluster of hundreds of bright stars. In this activity, students will determine the photographic scale,
and use
this to estimate the projected (2-D) distances between the stars in this cluster. They will also use internet and library resources to learn more about this
cluster.
[Grade level: 4-6 | Topics: Online research; Finding the scale of an image; metric measurement; decimal math] [Click here]
Problem 51
Sunspots Close-up and Personal -
Students will analyze a picture of a sunspot to learn more about its size, and examine the
sizes of various other features on the surface of the sun that astronomers study.
[Grade level: 6-8 | Topics: Finding the scale of an image; metric measurement; decimal math] [Click here]
Problem 50
Measuring the Speed of a Galaxy. -
Astronomers can measure the speed of a galaxy by using the Doppler Shift. By studying
the spectrum of the light from a
distant galaxy, the shift in the wavelength of certain spectral lines from elements such as hydrogen, can be decoded to
give the speed of the galaxy either towards the Milky Way or away from it. In this activity,
students will use the formula for the Doppler Shift to analyze the spectrum of the Seyfert galaxy Q2125-431
and determine its speed.
[Grade level: 6-8 | Topics: Interpolating data in a graph; decimal math] [Click here]
Problem 47
Discovering the Milky Way by Counting Stars. -
It is common to say that there are about 8,000 stars visible to the naked eye in
both hemispheres of the sky, although from a typical urban setting, fewer
than 500 stars are actually visible. Students will use data from a deep-integration image of a
region of the sky in Hercules, observed by the 2MASS sky survey project to estimate the number
of stars in the sky. This number is a lower-limit to the roughly 250 to 500 billion stars that
may actually exist in the Milky Way.
[Grade level: 4-6 | Topics: Tallying data; decimal math] [Click here]
Problem 46
A Matter of Perspective. -
Why can't we see aurora at lower latitudes on Earth? This
problem will have students examine the geometry of perspective, and how the altitude of an aurora or
other object, determines how far away you will be able to see it before it is below the local horizon.
[Grade level: 9-11 | Topics: Geometric proofs] [Click here]
Problem 29
The Wandering Magnetic North Pole
Mapmakers have known for centuries that Earth's
magnetic North Pole does not stay put. This activity will have students
read a map and calculate the speed of the 'polar wander' from 300 AD to
2000 AD. They will use the map scale and a string to measure the distance
traveled by the pole in a set period of time and calculate the wander
speed in km/year. They will answer questions about this changing speed.
[Grade: 6 - 8 | Topics: Interpreting graphical data; speed = distance/time] [Click here]
Problem 26
Super-sized Sunspots and the Solar
Cycle.Students compare the dates of
the largest sunspots since 1900 with the year of the peak sunspot cycle.
They check to see if superspots are more common after sunspot maximum or
before. They also compare superspot sizes with the area of earth.
[Grade: 6 - 8 | Topics: Interpreting tabular data; decimal math] [Click here]
Problem 3
Magnetic Storms II
>Students learn about the Kp index using a bar graph.
They use the graph to answer simple questions about maxima and time.
[Grade: 6 - 8 | Topics: Interpreting bar graphs; time calculations] [Click here]
Problem 1
Magnetic Storms I
Students learn about magnetic storms using real data
in the form of a line graph. They answer simple questions about data
range, maximum, and minimum. [Grade: 7 - 9 | Topics: Interpreting a graph; time calculations] [Click here]
Jump to Top of Page
Problem 502:The Frequency of Large Meteor Impacts
Problem 487: The Hubble eXtreme Deep Field
Problem 468: How Common are X-Class Solar Flares?
Problem 460: Fermi Explores the High-Energy Universe
Problem 403: The Goldilocks Planets - Not too hot or cold
Students use a table of the planets discovered by the Kepler satellite, and estimate the number of planets in our
Milky Way galaxy that are about the same size as Earth and located in their Habitable Zones.
They estimate the average temperature of the planets, and study their tabulated properties using histograms.
[Grade: 6-8 | Topics: Averaging; histogramming]
[Click here]
Problem 402: Kepler- Earth-like planets by the score! II
Students use recent Kepler satellite data summarized in tabular form to estimate the number of planets in the Milky Way galaxy
that are about the same size as our Earth, and located in their Habitable Zones were liquid water may exist.
[Grade: 6-8 | Topics: Percentage; re-scaling sample sizes]
[Click here]
Problem 401: Kepler - Earth-like planets by the score! I
Students use recent Kepler satellite data to estimate the number of Earth-like planets in the Milky Way galaxy.
[Grade: 6-8 | Topics: Percentage; histograms; Re-scaling sample sizes]
[Click here]
Problem 372: LRO Determines Lunar Cratering History
Problem 262: LRO Explore Lunar Surface Cratering
Students count the number of craters in various size ranges from a high-resolution image of the lunar surface.
[Grade: 6-8 | Topics: scale, proportion, ratio, area, density] [Click here]
Problem 261: LRO - Searching for Lunar boulders
Students use a recent image of the APollo-11 landing area to search for large lunar boulders.
[Grade: 6-8 | Topics: scale, ratio, proportion] [Click here]
Problem 253: NASA 'Sees' Carbon Dioxide
A satellite image of atmospheric carbon dioxide is used to estimate the geographic differences and identify human activity.
[Grade: 6-8 | Topics: interpreting a data image, unit conversion, gigatons ] [Click here]
Problem 252: Carbon Dioxide Increases
Students study the Keeling Curve to determine the rates of increase of carbon dioxide in the atmosphere.
[Grade: 6-8 | Topics: graph analysis, slope, rates, unit conversion, parts-per-million, gigatons] [Click here]
Problem 211: Where Did All the Stars Go?-
Students learn why NASA photos often don't show stars because of the way that cameras take pictures of bright and faint objects.
[Grade: 6-8| Topics: multiplication; division; decimal numbers.] [Click here]
Problem 194: A Magnetic Case for 'What Came First?' -
Students create a timeline for events based on several data plots from the THEMIS program, and use their timeline to answer questions about the causes of magnetic storms.
[Grade: 6-8| Topics: Time calculations] [Click here]
Problem 185: The International Space Station: Follow that graph!-
Students use a plot of the orbit altitude of the ISS to predict its re-entry year after the peak of the next solar activity cycle.
[Grade: 6-8| Topics: extrapolating a simple graph; estimation; forecasting] [Click here]
Problem 152: The Hubble Law -
Students plot the speed and distance to 7 galaxies and by deriving the slop of the linear model for the data points, obtain an estimate for the expansion
rate of the universe known as Hubble's Constant.
[Grade: 6-8 | Topics: Plotting data; determining the slope of the data;] [Click here]
Problem 120
Benford's Law
Students will explore a relationship called Benford's Law, which describes the frequency of the integers 1-9 in various data.
This law is used by the IRS to catch fradulent tax returns, but also applies to astronomical data and other surprising situations.
[Grade: 8-10 | Topics:Calculating frequency tables; Histogramming; Statistics] [Click here]
Problem 99
The Hinode Satellite Views the Sun -
Students will use a full-sun image from the new Hinode satellite
to sketch the locations of magnetic fields on the sun's surface using information in the introductory article as a guide.
[Grade level: 6-8 | Topics:image interpretation; eye-hand coordination; reading to be informed] [Click here]
Problem 95
A Study on Astronaut Radiation Dosages in SPace -
Students will examine a graph of the astronaut radiation dosages for Space Shuttle flights, and estimate the
total dosages for astronauts working on the International Space Station.
[Grade level: 9-11 | Topics:Graph analysis, interpolation, unit conversion] [Click here]
Problem 94
Solar Storms: Odds, Fractions and Percentages -
Students will use actual data on solar storms to learn
about the
different kinds of storms and how common they are. This is a basic science activity that
professionals do in order to look for relationships between different kinds of events
that might
lead to clues about what causes them. Can your students come up with something new that
noone has thought about before? The Venn Diagramming activity is a key element of the activity and is reasonably challenging!
[Grade level: 6-8 | Topics: Averaging; fractions; percentages; odds; Arithmetic Operations; Venn Diagrams] [Click here]
Problem 90
A Career in Astronomy -
This problem looks at some of the statistics of working in a field like astronomy. Students will read graphs and answer questions about
the number of astronomers in this job area, and the rate of increase in the population size
and number of advanced degrees.
[Grade level: 6-8 | Topics: graph reading; percentages; interpolation] [Click here]
Problem 86
Do Fast CMEs Produce SPEs? -
Recent data on solar proton storms (SPEs) and coronal mass ejections (CMEs) are compared using Venn Diagrams
to see if the speed of a CME makes solar proton storms more likely or not.
[Grade level: 5-8 | Topics: Venn Diagrams; counting; calculating percentages and odds] [Click here]
Problem 85
The Solar Tsunami! -
Recent data from the Hinode satellite is used
to measure the speed of a solar explosion on the surface of the sun using a
series of images taken by the satellite at three different times.
Students calculate the speed of the blast between the first pair and last pair of images, and determine if the
blast wave was accelerating or decellerating in time.
[Grade level: 5-8 | Topics: Finding image scale; calculating time differences; calculating speed from distance and time] [Click here]
Problem 70
Calculating Total Radiation Dosages at Mars -
This problem uses data from the Mars Radiation Environment Experiment (MARIE) which is orbiting Mars, and measures the daily radiation dosage
that an astronaut would experience in orbit around Mars. Students will use actual plotted data to calculate the total dosage by adding up the areas under the data curve. This
requires knowledge of the area of a rectangle, and an appreciation of the fact that the product of a rate (rems per day) times the time duration (days) gives a total dose (Rems), much like the product of speed times time gives distance.
Both represent the areas under their appropriate curves. Students will calculate the dosages for cosmic radiation and solar proton flares, and decide which component produces the most severe radiation problem.
[Grade level: 6-8 | Topics: decimals, area of rectangle, graph analysis] [Click here]
Problem 53
Astronomy: A Moving Experience! -
Objects in space move. To figure out how fast they move,
astronomers use many different techniques depending on what they are investigating.
In this activity, you will measure the speed of astronomical phenomena using the scaling
clues and the time intervals between photographs of three phenomena: A supernova
explosion, a coronal mass ejection, and a solar flare shock wave.
[Grade level: 6-8 | Topics: Finding the scale of an image; metric measurement; distance = speed x time; scientific notation] [Click here]
Problem 32
Solar Proton Events and Satellite
DamageStudents will examine the
statistics for Solar Proton Events since 1996 and estimate their damage to
satellite solar power systems. [Grade: 7 - 9 | Topics: Interpreting tabular data; histogramming] [Click here]
Problem 28
Satellite Power and Cosmic Rays
Most satellites operate by using solar cells to
generate electricity. But after years in orbit, these solar cells produce
less electricity because of the steady impact of cosmic rays. In this
activity, students read a graph that shows the electricity produced by a
satellite's solar panels, and learn a valuable lesson about how to design
satellites for long-term operation in space. Basic math ideas: Area
calculation, unit conversions, extrapolation and interpolation of graph
trends. [Grade: 6 - 8 | Topics: Interpreting graphical data; decimal math] [Click here]
Problem 27
Satellite Failures and the Sunspot
Cycle There are over 1500 working
satellites orbiting Earth, representing an investment of 160 billion
dollars. Every year, between 10 and 30 of these re-enter the atmosphere.
In this problem, students compare the sunspot cycle with the record of
satellites re-entering the atmosphere and determine if there is a
correlation. They also investigate how pervasive satellite technology has
become in their daily lives. [Grade: 6 - 8 | Topics: Graphing tabular data; decimal math] [Click here]
Problem 9
Aurora Power!
Students use data to estimate the power of an aurora, and compare it to
common things such as the electrical consumption of a house, a city and a
country. [Grade: 5 - 7 | Topics: Interpreting tabular data] [Click here]
Problem 8
Making a Model Planet
Students use the formula for a sphere, and the
concept of density, to make a mathematical model of a planet based on its
mass, radius and the density of several possible materials (ice, silicate
rock, iron, basalt). [Grade: 7 - 9 | Topics: Volume of sphere; mass = density x volume; decimal math; scientific notation] [Click here]
Problem 7
Solar Flares, CME's and Aurora
Some articles about the Northern Lights imply that
solar flares cause them. Students will use data to construct a simple Venn
Diagram, and answer an important question about whether solar flares cause
CME's and Aurora. [Grade: 5 - 7 | Topics: Venn Diagramming] [Click here]
Problem 1
Magnetic Storms I
Students learn about magnetic storms using real data
in the form of a line graph. They answer simple questions about data
range, maximum, and minimum. [Grade: 7 - 9 | Topics: Interpreting a graph; time calculations] [Click here]
Jump to Top of Page
Problem 564:Exploring the Stars in Orion - Light Year Madness
Problem 507: Exploring the Launch of the Falcon 9
Problem 505: SDO Sees Coronal Rain - Estimating Plasma Speeds
Problem 488: RBSP and the Location of Dawn Chorus - II
Problem 452: The Closest Approach of Asteroid 2005YU55 - I
Problem 451: The Spectacular Cat's Eye Planetary Nebula
Problem 445: LRO - The relative ages of lunar surfaces
Problem 438: The Last Flight of the Space Shuttle Endeavor
Problem 437: Saturn V Rocket Launch Speed and Height
Problem 436: Space Shuttle Challenger Deploys the INSAT-1B Satellite
Problem 435: Apollo-17 Launch from Lunar Surface
Problem 434: Dawn Spacecraft Sees Asteroid Vesta Up-Close!
Problem 433: Space Shuttle Atlantis - Plume Speed
Problem 432: Space Shuttle Atlantis - Exhaust Speed
Problem 431: Space Shuttle Atlantis - Launch Speed
Problem 430: Space Shuttle Atlantis - Ascent to Orbit
Problem 429: Tracking a Sea Turtle from Space
Problem 404: STEREO Spacecraft give 360-degree Solar View
Students use STEREO satellite images to determine which features can be seen from Earth and which cannot. They learn
about the locations and changing positions of the satellites with respect to Earth's orbit.
[Grade: 6-8 | Topics: angular measure, extrapolation; distance = speed x time]
[Click here]
Problem 267: Identifying Materials by their Reflectivity
The reflectivity of a material can be used to identify it. This is important when surveying the lunar surface for
minerals, and also in creating 'green' living environments on Earth.
[Grade: 6-8 | Topics: percentage, interpreting tabular data, area ] [Click here]
Problem 237: The Martian Dust Devils
Students determine the speed and acceleration of a Martian dust devil from time laps images and information about the scale of the image.
[Grade: 6-8 | Topics: scales; Determining speed from sequential images; V = D/T] [Click here]
Problem 247: Space Mobile Puzzle
Students calculate the missing masses and lengths in a mobile using the basic balance equation m1 x r1 = m2 x r2 for a
solar system mobile.
[Grade: 6-8 | Topics: metric measure, algebra 1, geometry] [Click here]
Problem 245: Solid Rocket Boosters
Students learn how SRBs actually create thrust, and study the Ares-V booster to estimate its thrust.
[Grade: 6-8 | Topics: volume, area, unit conversions] [Click here]
Problem 238: Satellite Drag and the Hubble Space Telescope
Satellite experience drag with the atmosphere, which eventually causes them to burn up in the atmosphere. Students study
various forecasts of the altitude of the Hubble Space Telescope to estimate its re-entry year.
[Grade: 6-8 | Topics: interpreting graphical data; predicting trends] [Click here]
Problem 211: Where Did All the Stars Go?-
Students learn why NASA photos often don't show stars because of the way that cameras take pictures of bright and faint objects.
[Grade: 6-8| Topics: multiplication; division; decimal numbers.] [Click here]
Problem 209: How to make faint things stand out in a bright world!-
Students learn that adding images together often enhances faint things not seen in only one image; the power of averaging data.
[Grade: 6-8| Topics: multiplication; division; decimal numbers.] [Click here]
Problem 148
Exploring a Dying Star
Students use data from the Spitzer satellite to calculate the mass of a planetary nebula from a dying star.
[Grade: 9 - 11 | Topics:Scientific Notation; unit conversions; volume of a sphere ] [Click here]
Problem 141
Exploring a Dusty Young Star
Students use Spitzer satellite data to learn about how dust emits infrared light and
calculate the mass of dust grains from a young star in the nebula NGC-7129.
[Grade: 4 - 7 | Topics: Algebra I; multiplication, division; scientific notation] [Click here]
Problem 134
The Last Total Solar Eclipse--Ever!
Students explore the geometry required for a
total solar eclipse, and estimate how many years into the future the last total solar
eclipse will occur as the moon slowly recedes from Earth by 3 centimeters/year.
[Grade: 7 - 10 | Topics:Simple linear equations] [Click here]
Problem 124
The Moon's Atmosphere
Students learn about the moon's very thin atmosphere by calculating its total mass in kilograms using the volume of a spherical shell and the measured density.
[Grade: 8-10 | Topics:volume of sphere, shell; density-mass-volume; unit conversions] [Click here]
Problem 115
A Mathematical Model of the Sun
Students will use the formula for a sphere and a shell to calculate the mass of the
sun for various choices of its density. The goal is to reproduce the measured mass and radius of the sun by
a careful selection of its density in a core region and a shell region. Students will manipulate the values for density and shell size to
achieve the correct total mass. This can be done by hand, or by programming
an Excel spreadsheet.
[Grade: 8-10 | Topics: scientific notation; volume of a sphere and a spherical shell; density, mass and volume.] [Click here]
Problem 95
A Study on Astronaut Radiation Dosages in SPace -
Students will examine a graph of the astronaut radiation dosages for Space Shuttle flights, and estimate the
total dosages for astronauts working on the International Space Station.
[Grade level: 9-11 | Topics:Graph analysis, interpolation, unit conversion] [Click here]
Problem 83
Luner Meteorite Impact Risks -
In 2006, scientists identified 12 flashes of light on the moon that were probably meteorite impacts.
They estimated that these meteorites were probably about the size of a grapefruit.
How long would lunar colonists have to wait before seeing such a flash within their horizon? Students
will use an area and probability calculation to discover the average waiting time.
[Grade level: 8-10 | Topics: arithmetic; unit conversions; surface area of a sphere ] [Click here]
Problem 74
A Hot Time on Mars -
The NASA Mars Radiation Environment (MARIE) experiment has created a map of the surface of mars, and measured the ground-level radiation background that astronauts would be exposed to.
This math problem lets students examine the total radiation dosage that these explorers would receive on a series of 1000 km journeys across the martian
surface. The students will compare this dosage to typical background conditions on earth and in the International Space Station to get a sense of perspective
[Grade level: 6-8 | Topics: decimals, unit conversion, graphing and analysis ] [Click here]
Problem 71
Are the Van Allen Belts Really Deadly? -
This problem explores the radiation dosages that astronauts would receive as they travel
through the van Allen Belts enroute to the Moon. Students will use data to calculate the duration of the trip through the belts, and the total received dosage, and compare this to a lethal dosage to
confront a misconception that Apollo astronauts would have instantly died on their trip to the Moon.
[Grade level: 8-10 | Topics: decimals, area of rectangle, graph analysis] [Click here]
Problem 68
An Introduction to Space Radiation -
Read about your natural background radiation dosages, learn about
Rems and Rads, and the difference between low-level dosages and high-level dosages. Students use
basic math operations to calculate total dosages from dosage rates, and calculating cancer risks.
[Grade level: 6-8 | Topics: Reading to be Informed; decimals, fractions, square-roots] [Click here]
Problem 66
Background Radiation and Lifestyles -
Living on Earth, you will be subjected to many different radiation
environments. This problem follows one person through four different possible futures, and compares the
cumulative lifetime dosages.
[Grade level: 6-8 | Topics: fractions, decimals, unit conversions] [Click here]
Problem 54
Exploring Distant Galaxies -
Astronomers determine the redshifts of distant
galaxies by using spectra and measuring the wavelength shifts for familiar
atomic lines. The larger the redshift, denoted by the letter Z, the more distant the galaxy.
In this activity, students will use an actual image of a distant corner of the universe, with the redshifts
of galaxies identified. After histogramming the redshift distribution, they will use an
on-line cosmology calculator to determine the 'look-back' times for the galaxies and
find the one that is the most ancient galaxy in the field. Can students find a galaxy formed only
500 million years after the Big Bang?
[Grade level: 6-8 | Topics: Decimal math; using an online calculator; Histogramming data] [Click here]
Problem 49
A Spiral Galaxy Up Close. -
Astronomers can learn a lot from studying photographs of galaxies. In
this activity, students will compute the image scale (light years per millimeter) in a
photograph of a nearby spiral galaxy, and explore the sizes of the features found in the image. They
will also use the internet or other resources to fill-in the missing background information about this galaxy.
[Grade level: 6-8 | Topics: Online research; Finding the scale of an image; metric measurement; decimal math] [Click here]
Problem 41
Solar Energy in Space
Students will calculate the area of a satellite's surface
being used for solar cells from an actual photo of the IMAGE satellite.
They will calculate the electrical power provided by this one panel. Students
will have to calculate the area of an irregular region using nested rectangles.
[Grade level: 7-10 | Topics: Area of an irregular polygon; decimal math] [Click here]
Problem 36
The Space Station Orbit Decay and Space
WeatherStudents will learn about
the continued decay of the orbit of the International Space Station by
studying a graph of the Station's altitude versus time. They will
calculate the orbit decay rates, and investigate why this might be
happening. [Grade: 5 - 8 | Topics: Interpreting graphical data; decimal math] [Click here]
Problem 31
Airline Travel and Space Weather
Students will read an excerpt from the space weather
book 'The 23rd Cycle' by Dr. Sten Odenwald, and answer questions about
airline travel during solar storms. They will learn about the natural
background radiation they are exposed to every day, and compare this to
radiation dosages during jet travel. [Grade: 6 - 8 | Topics: Reading to be informed; decimal math] [Click here]
Problem 10
The Life Cycle of an Aurora
Students examine two eye-witness descriptions of an
aurora and identify the common elements so that they can extract a common
pattern of changes. [Grade: 4 - 6 | Topics: Creating a timeline from narrative; ordering events by date and time] [Click here]
Properties of Numbers, Fractions, Percentage, Scientific Notation, Unit Conversions
Students examine how often newly discovered comets approach Earth and become a hazard, and how soon after discovery these close passes can occur.
[Grade: 3-5 | Topics: Averaging, percentages]
[Click here]
Students use tabular data on the detection of new comets since 1999 to explore detection rates over time.
[Grade: 3-5 | Topics: Percentages]
[Click here]
Students use an image from IRIS to examine the sizes and equivalent energy of bright regions in the solar transition region.
[Grade: 6-8 | Topics: percentage; proportion; scale; scientific notation; volume of a cylinder]
[Click here]
Students estimate their weight on different planets, moons and asteroids.
[Grade: 6-8 | Topics: proportions]
[Click here]
Students convert from percentage units to parts per million and compare trace gases in the atmospheres of various planets.
[Grade: 6-8 | Topics: percentages; unit conversions ]
[Click here]
Students study the composition of planetary atmospheres and compare the amounts of certain compounds in them
[Grade: 6-8 | Topics: Pie graphs; percentages; scientific notation]
[Click here]
Students learn about the light travel times to the 8 planets by converting the distances in Astronomical Units to travel times at the speed of light.
[Grade: 6-8 | Topics: Proportions; unit conversions; time = distance/speed; metric units]
[Click here]
Students work with proportions to convert solar system distances into Astronomical Units for the 8 planets.
[Grade:6-8 | Topics: Proportions; unit conversions]
[Click here]
Students learn about how simple fractions are used to describe gears and gear trains that reduce or increase speed.
[Grade: 4-7 | Topics: multiplying simple fractions]
[Click here]
Students estimate the area of the Arctic ozone hole, and work with the concept of parts-per-million to estimate total ozone volume lost. [Grade: 6-8 | Topics: Area of rectangle; volume; percentage]
[Click here]
Students determine how often the two stars Kepler 16 A and B will line up with Tatooine on
the same day of the year. [Grade: 6-8 | Topics: comparing two sequences of numbers; patterns, Least Common Multiple]
[Click here]
Students count hydrogen, carbon and oxygen atoms in a molecule of adefovir dipivoxil and calculate its mass and formula.[Grade: 6-8 | Topics: Counting; Scientific Notation]
[Click here]
A starfield image taken by the 2MASS survey is analyzed to estimate how many stars are in the sky. [Grade: 6-8 | Topics: Scaling; unit conversion; angular measure]
[Click here]
The track of an asteroid in a Hubble image of a cluster of galaxies is analyzed to determine speed of the asteroid.[Grade: 6-8 | Topics: Scaling; unit conversion; speed=distance/time]
[Click here]
Graphs, Graphical Analysis and Rates
Students design two telescopes given information about the desired properties for conducting research.
[Grade: 6-8 | Topics: graphing inequalities; evaluating simple equations ]
[Click here]
Students collect data and explore the inverse square law using a light meter. They deduce the formula for the brightness of a lamp given its distance and wattage.
[Grade: 6-8 | Topics: graphing tabular data; surface area of a sphere; ]
[Click here]
Students use tabular data to determine the date and time of closest approach to Mars
[Grade: 3-5 | Topics: graphing tabular data]
[Click here]
Students use tabulated data to estimate when this comet made its closest approach to the sun in 2013.
[Grade: 6-8 | Topics: graphing tabular data; scale; measurement; distance between points]
[Click here]
Students explore how close Comet ISON will get to Mercury, Venus, Earth and Mars during its 2013 passage.
[Grade: 3-5 | Topics: Interpreting tabular data; graphing ]
[Click here]
Students work with data presented in bar graphs to estimate how many more hazardous Near Earth Objects (NEOS) remain to be found.
[Grade: 6-8 | Topics:bar graphs ]
[Click here]
Students graph tabulated data to determine when this asteroid is closest to Earth and its speed at that time.
[Grade: 6-8 | Topics: graphing tabular data; solving a linear equation]
[Click here]
Students study planet growth by using a clay model of planetessimals combining to form a planet by investigating volume addition with spheres.
[Grade: 3-5 | Topics: graphing; counting]
[Click here]
Students explore the method of triangulation and how it might be used by the RBSP spacecraft to find the origin of the Chorus signals.
[Grade: 6-8 | Topics: Graphing on the Cartesian plane; distances between points. ]
[Click here]
Students use a series of images from a launch video to determine the scale of each image and
determine the speed of the rocket as it leaves the gantry.
[Grade: 6-8 | Topics: scale models; speed = distance/times]
[Click here]
Students use tabulated altitude and range data following the launch of the Juno mission, to determine the speed of the rocket as it travels from the ground to earth orbit.
[Grade: 6-8 | Topics: scale models; speed = distance/time]
[Click here]
Students explore volume density and mass using the Space Shuttle thermal tiles.
[Grade: 6-8 | Topics: mass = density x volume; metric conversion]
[Click here]
Students work with the properties of circles and angular measure to see where the moon will be at the start of the asteroid encounter.
[Grade: 6-8 | Topics: angular measure; time=distance/speed; scale models; metric math]
[Click here]
Students investigate the loopy orbit of the THEMIS/Artemis spacecraft as they are being inserted into lunar orbit. To save fuel, their orbits take them on a complicated path in space.
[Grade: 6-8 | Topics: distance=speedxtime; scientific notation; unit conversion]
[Click here]
Students use a graph to compare the brightness of supernova produced by three different masses of stars, and predict whether the Webb Space Telescope can see them.
[Grade: 6-8 | Topics: Analyzing a graph; interpreting mathematical models]
[Click here]
The Rosette mission flew by an asteroid. An application of the Pythagorean Theorem and angular size.[Grade: 6-8 | Topics: image scale; Pythagorean Theorem; rates]
[Click here]
From a graph, students predict how much bone loss an astronaut experiences during a long-duration stay in space.[Grade: 6-8 | Topics: Rates; linear equations]
[Click here]
Students plot the circular shape of the track of the North Pole during a 2-year period and estimate the speed of movement. [Grade: 6-8 | Topics: Graphing ordered pairs]
[Click here]
Working with Equations and Formulae
Students explore the elliptical orbit of Halleys Comet and determine its period and the speed of the comet.
[Grade: 6-8 | Topics: speed=distance/time]
[Click here]
Students compare several telescopes and select the one with the best performance and lowest cost.
[Grade: 6-8 | Topics: simple ratio formula; decimal math]
[Click here]
Students design pendulum clocks for mars and the moon, and how pendulums can be used for mining on Earth.
[Grade: 6-8 | Topics: evaluating square-root equations; scientific notation ]
[Click here]
Students calculate the light gathering ability of various telescopes compared to the human eye.
[Grade: 6-8 | Topics: Area of a circle ]
[Click here]
Students fill in missing numbers in a table using proportions and evaluating a simple equation for magnification.
[Grade: 6-8 | Topics: proportions]
[Click here]
Students learn about the basic terms that define the performance of a digital camera or a telescope.
[Grade: 6-8 | Topics: fractions; integer division; evaluating simple equations ]
[Click here]
Students learn about the orbit speeds of ring particles and how orbit periods in the Cassini Division relate to the orbit of the moon Mimas.
[Grade: 6-8 | Topics: square root formulae; circumference of circle; speed = distance/time ]
[Click here]
Students examine how volcanic activity on Jupiters satellite Io can lead to resurfacing the entire moon in less than a million years covering all new craters.
[Grade: 6-8 | Topics: Surface aea of a sphere; rates; scientific notation]
[Click here]
Students estimate how quickly this planet will lose its atmosphere and evaporate at its present loss rate of 6 million tons/second
[Grade: 6-8 | Topics:mass=densityx volume; rates; volume of a sphere ]
[Click here]
Students estimage how much mass the comet will loose at its present rate.
[Grade: 6-8 | Topics: volume of a sphere; rates; mass=density x volume]
[Click here]
Students determine the ejection speed and heights of gasses vented by geysers and volcanoes.
[Grade: 6-8 | Topics: solving square root equations; ]
[Click here]
Students examine a ball bouncing down a flight of stairs and compare this to how van Allen particles gain their energy from numerous small boosts.
[Grade: 6-8 | Topics: equations; scientific notation]
[Click here]
Students explore how long it takes our fastest rockets to reach each of the planets.
[Grade: 6-8 | Topics: time=distance/speed; metric conversion]
[Click here]
Students graph a magnetic field line in the First Quadrant, then calculate the
segment midpoints using the Midpoint Formula, and then draw tangent lines at each midpoint to determine compass direction.
[Grade: 7-8 | Topics: Graphing in the XY plane; midpoint formula; tangent lines to curves]
[Click here]
Students plot points along a magnetic field line in the First Quadrant,
then use reflection symmetry to complete the field line shape in all four quadrants.
[Grade: 6-8 | Topics: graphing in XY plane; reflection symmetry]
[Click here]
The location of the Chorus signal from each of the RBSP spacecraft is given by a linear equation that represents the direction along which the signal is detected by each spacecraft. Students solve the two linear
equations for the common intersection point representing the location of the Chorus signal in space. This can be done graphically by plotting each linear equation, or solved algebraically.
[Grade: 6-8 | Topics: Linear equations; solving systems of equations; graphical solutions ]
[Click here]
Students explore the expanding U Camelopardalis gas shell imaged by the Hubble Space Telescope, to determine its age and the density of its gas.
[Grade: 6-8 | Topics: Scientific Notation; distance = speed x time; density=mass/volume ]
[Click here]
Students explore how the speed of an orbiting satellite changes if it were near a black hole with five times the mass of our Earth.
[Grade: 6-8 | Topics: Evaluating an equation with one variable; square roots; speed = distance/time; circumference of a circle]
[Click here]
Students calculate the angular sizes and scales of distant objects to study how different sized
telescopes see details with varying degrees of clarity.
[Grade: 7-9 | Topics: solving a simple equation for X; angular measure; Scientific Notation]
[Click here]
Global climate change is causing measurable sea level changes. Which part of the United States is sinking the fastest? [Grade: 6-8 | Topics: fitting linear equations to graphical data]
[Click here]
Geometry
Students desigh digital cameras for telescopes given information about the image scale of the telescope and the pixel dimensions.
[Grade: 6-8 | Topics: area; evaluating simple equations; unit conversions]
[Click here]
Students learn about digital cameras and how to interpret formats, megapixels and angular resolution.
[Grade: 6-8 | Topics: integer math; area of a square]
[Click here]
Students determine the resolving power of a telescope and the limit to the finest details that can be see for a telescope of a specific diameter.
[Grade: 6-8 | Topics: Angular measure; arcseconds; simple equations ]
[Click here]
Students calculate the angular field of view for various telescopes using a simple formula of the form: F = A/B
[Grade: 6-8 | Topics: Angular measure; degrees]
[Click here]
Students explore how satellite observing swaths add up to give full coverage of earth's surface.
[Grade: 6-8 | Topics: geometry;scale model; working with square roots ]
[Click here]
Students compare the dimensions of the rings of Jupiter, Saturn, Uranus and Neptune to the radius of each planet, and the location of the break up Tidal Limit to test an idea of how the rings may have formed.
[Grade: 6-8 | Topics: scale model; proportions; number line ]
[Click here]
Students use an image of a ring of Saturn to investigate its thickness using shadows cast by ringlet material kicked up by a passing moon.
[Grade: 6-8| Topics: scales; proportions; triangle geometry; angle measurement]
[Click here]
Students estimate the average arrival time of large asteroids that impacted the moon. They work with the formula for the volume of a sphere to estimate how much additional mass was added to the moon and Earth durung this era.
[Grade: 6-8 | Topics: volume of spheres; proportions]
[Click here]
Students work with image of agricultural area to estimate the percentage of area cultivated and the total rainfall in gallons per year.
[Grade: 6-8 | Topics: area of square and rectangle; metric units; unit conversion]
[Click here]
Students work with an image of the universe when it was 370,000 years old and determine from simple scaling and
proportions the sizes of the features seen in the image compared to the Milky Way.
[Grade: 6-8 | Topics: scale and proportion; angular measure]
[Click here]
Students work with images of the Grail impact sites to estimate the diameter of the crater created
after the spacecraft impacted the moon.
[Grade: 6-8 | Topics: scale and proportion; volume of cylinder; mass=DensityxVolume]
[Click here]
Students work with the circumference of Mars and the speed of shock waves in the martian crust to estimate the arrival times of the waves at the InSight Lander.
[Grade: 6-8 | Topics: speed=distance/time; Time calculations; circumference of a circle]
[Click here]
Students plot the position of the Curiosity Rover on a cartesian grid covering the satellite image of the landing area. They use the 2-point distance formula to determine how far the rover
traveled between stops, and determine it speed.
[Grade: 6-8 | Topics: Cartseian graphs; ordered pairs and coordinates; distance = speed x time; metric measure ]
[Click here]
The star LL Persei is ejecting gas like a sprinkler on a lawn. Every 800 years the gas makes one complete
orbit, and over time forms a spiral pattern in space. Students explore the timing of this pattern and estimate the size and age of this gas.
[Grade: 6-8 | Topics: Distance = speed x time; unit conversions; evaluating formulas ]
[Click here]
Students use Landsat imagery from 1972 and 2011 to determine how much additional water is being used for irrigation in a small region of Kansas.
[Grade: 6-8 | Topics: Area of a circle; unit conversions ]
[Click here]
Students use two images from the Solar Dynamics Observatory to estimate the speed of the X-class solar flare on March 6, 2012.
[Grade: 6-8 | Topics: speed=distance/time; scale model; metric measurement]
[Click here]
Rockets use fuel tanks that can be approximated as cylinders. In this simple geometric exercise, students work the formula for the
volume of a cylinder to add a fuel gauge at the right level to indicate how much fuel remains.
[Grade: 7-9 | Topics: VOlume of cylinder; proportions]
[Click here]
Students explore proportions and angular size using images of Saturn's moons Titan and Dione
[Grade: 7-9 | Topics: scale models; proportions]
[Click here]
Students explore the orbit speeds of Tatooine and Kepler-16B and predict how often the two stars line up with the planet
to create an 'eclipse'. [Grade: 6-9 | Topics: angle measure; angular speed]
[Click here]
Students use a recent image obtained by the LRO spacecraft to estimate how far astronauts walked to get to various points in the
landing area.
They also estimate how many craters are in this area and the average impact time between crater events.
[Grade: 6-8 | Topics: image scale; metric measurement]
[Click here]
The planet CoRot2b is losing mass at a rate of 5 million tons per second. Students estimate how long it will
take for the planet to lose its atmosphere
[Grade: 6-8 | Topics: Scientific Notation; Rate = Amount/Time]
[Click here]
Students use two images created by a supercomputer calculation to explore the size and accuracy of computer models of the distanct universe.
[Grade: 7-9 | Topics: scale model; proportions; Scientific Notation]
[Click here]
Students use the published LRO temperature map to study the scale of the South Polar Region, the sizes of its craters,
and estimate the volume of water-ice that may be present in the Shackleton Crater.
[Grade: 7-9 | Topics: Volume of a circular disk; scale models]
[Click here]
A statistical study of the 700 transits seen during the first 43 days of the mission. [Grade: 6-8 | Topics: Percentages; area of circle]
[Click here]
Measurement
Data Analysis and Probability
Students examine how often a large meteor should be visible like the one that exploded over Russia on February 14, 2013. This asteroid had a mass of 10,000 tons and injured over 1000 people.
[Grade: 6-8 | Topics: percercentages, areas]
[Click here]
Students use the Hubble XDF to estimate the number of galaxies in the visible universe.
[Grade: 6-8 | Topics: Counting, areas, proportions ]
[Click here]
Students use simple statistics to determine the solar flare frequency during the last 11-year
sunspot cycle to estimate the time between X-class flares during the current sunspot cycle
[Grade: 5-7 | Topics: mean, median, percentage]
[Click here]
Students work with percentages to explore the identities of the 1873 gamma-ray sources detected by NASAs Fermi Observatory
[Grade: 6-8 | Topics: percentages; pie graphs]
[Click here]
Students count large craters on an LRO coded image of the lunar surface to estimate whether the impacting asteroids
that produced the largest
craters were from the same population of asteroids during the two different epocs of impacts.
[Grade: 6-8 | Topics: Scaled images; probability; percentages]
[Click here]
Problem Solving
Students explore the light year and its relationship to light travel time for observing events in different parts of space. When would colonists at different locations observe the star Betelgeuse become a supernova?
[Grade: 6-8 | Topics: time lines; time interval calculations; time = distance/speed ]
[Click here]
Students use data from the launch of the Falcon 9 booster to determine its speed and acceleration.
[Grade: 6-8 | Topics: speed=distance/time; Time calculations]
[Click here]
Students estimate the speed of plasma streamers near the solar surface using images from a Solar Dynamics Observatory.
[Grade: 6-8 | Topics: scale models; speed=distance/time; proportions]
[Click here]
Students use hypothetical information from the twin RBSP spacecraft to triangulate the location of the Chorus signal near Earth using angle measurements, graphing and protractors to identify the intersection point of the CHorus signals.
[Grade: 6-8 | Topics: Angles; graphing; protractors ]
[Click here]
Students work with a scaled drawing of the orbit of the moon and the asteroid trajectory to predict where the asteroid will be relative to earth and the orbit of the moon.
[Grade: 6-8 | Topics: time=distance/speed; scale models; metric math]
[Click here]
Students measure the diameter of the nebula and use speed information to estimate the age of the nebula
[Grade: 6-8 | Topics: time=distance/speed; scale models; metric math]
[Click here]
Students examine two Apollo landing areas using images from the LRO spacecraft to estimate the relative ages of the two regions using
crater counting. [Grade: 6-8 | Topics: scale; histogramming]
[Click here]
Students use tabular data and graphing to determine the launch speed and acceleration of the Space Shuttle from the launch pad. [Grade: 6-8 | Topics: tabular data, graphing, metric measurement, speed=distance/time]
[Click here]
Students use tabular data to determine the launch speed of the Saturn V rocket from the launch pad.
[Grade: 6-8 | Topics: tabular data, graphing, metric measurement, speed=distance/time]
[Click here]
Students use a sequence of images to determine the launch speed of the satellite from the Space Shuttle cargo bay.
[Grade: 6-8 | Topics: scale, metric measurement, speed=distance/time]
[Click here]
Students use a sequence of images to determine the speed of ascent of the Apollo-17 capsule from the lunar surface.
[Grade: 6-8 | Topics: scale, metric measurement, speed=distance/time]
[Click here]
Students use an image of the asteroid to determine the diameters of craters
and mountains using a millimeter ruler and the scale of the image in meters per millimeter.
[Grade: 6-8 | Topics: scale, metric measurement]
[Click here]
Students use a sequence of images from a video of the launch to determine speed from the time
interval between the images, and the scale of each image.
[Grade: 6-8 | Topics: scale, metric measurement, speed=distance/time]
[Click here]
Students use a sequence of images from a video of the launch to determine speed from the time
interval between the images, and the scale of each image.
[Grade: 6-8 | Topics: scale, metric measurement, speed=distance/time]
[Click here]
Students use a sequence of images from a video of the launch to determine speed from the time
interval between the images, and the scale of each image.
[Grade: 6-8 | Topics: scale, metric measurement, speed=distance/time]
[Click here]
Students use a sequence of images from a video of the launch to determine speed from the time
interval between the images, and the scale of each image.
[Grade: 6-8 | Topics: scale, metric measurement, speed=distance/time]
[Click here]
The latitude, longitude, elapsed time and distance traveled are provided in a table. Students use the data to determine the daily and hourly speed of a leatherback turtle as it travels from New Zealand to California across the Pacific Ocean.
[Grade: 4-6| Topics: scale, metric measurement, speed=distance/time]
[Click here]
NASA’s STEAM Innovation Lab is a think tank with an emphasis on space science content applications.