Books from SpaceMath

Stars (2012: 21 Problems) This book provides basic information and math problems involving Scientific Notation, and related to the properties and evolution of stars. Artwork by Nathalie Rattner. [Click here]

Exploring Stars in the Milky Way (2012: 18 Problems) This is an introduction to stars, their numbers and their magnitude scales. Exercises in counting stars, working with the logarithmic magnitude scale. [Click here]

Black Hole Math (2012: 53 Problems) This book provides an introduction to the basic properties of black holes using elementary algebra
and geometry. Students calculate black hole sizes from their mass, time and space distortion, learn about world lines, light cones and simple spacetime diagrams,
and explore the impact that black holes have upon their surroundings.
[Click here]
Math problems about Stars
Problem 669: Exploring Two Nearby Stars to the Sun. Students explore two nearby stars Ross 128 and Gliese 445 and determine when they will be the nearest stars to our sun by working with quadratic equations that model their distances. [Grade: 9-12 | Topics: Working with quadratic equations; intersection points of quadratic functions] [Click here]
Problem 665: Kepler - Keplers Latest Count on Goldilocks Planets Students examine the statistics of the latest candidate planets beyond our solar system, work with poercentages and a bar graph, and estimate the number of earth-like planets in our Milky Way. [Grade: 6-8 | Topics: percentages, bar graphs, estimation] [Click here]
Problem 664: HST - The Suns Nearest Companions at least for now! Students study a graph that models the distances from the sun of seven nearby stars over a 100,000 year time span. They determine the minimum distances and a timeline of which star will be the suns new closest neighbor in space in the next 80,000 years. [Grade: 6-8 | Topics: Graphical data; finding minimum from a plotted curve] [Click here]
Problem 608: Constellations in 3D Students create a 3-d model of the constellation Orion and explore how stars are located in space and how this perspective changes from different vantage points. [Grade: 6-8 | Topics: geometry; scale] [Click here]
Problem 564:Exploring the Stars in Orion - Light Year Madness Students explore the light year and its relationship to light travel time for observing events in different parts of space. When would colonists at different locations observe the star Betelgeuse become a supernova? [Grade: 6-8 | Topics: time lines; time intervalcalculations; time = distance/speed ] [Click here]
Problem 561:Exploring the Evaporating Exoplanet HD189733b Students estimate how quickly this planet will lose its atmosphere and evaporate at its present loss rate of 6 million tons/second [Grade: 6-8 | Topics:mass=densityx volume; rates; volume of a sphere ] [Click here]
Problem 517: A Distant Supernova Remnant Discovered Students work with proportions and scaling to discover the size of the supernova remnant compared to the distance from the Sun to the nearest star Alpha Centauri. The also work with time and speed calculations to estimate the speed of the supernova compared to the International Space Station. [Grade: 6-8 | Topics: proportions; speed=distance/time] [Click here]
Problem 494: The Close Encounter to the Sun of Barnards Star
Students use parametric equations and calculus to determine the linear equation for the path of Barnards Star, and then determine when the minimum distance to the sun occurs
[Grade: 12 | Topics: Derivitives and minimization]
[Click here]
Problem 483: The Radioactive Dating of a Star in the Milky Way!
Students explore Cayrel's Star, whose age has been dated to 12 billion years using a radioisotope dating technique involving the decay of uranium-238.
[Grade: 9-12 | Topics: half-life; exponential functions; scientific notation]
[Click here]
Problem 482: Exploring Density, Mass and Volume Across the Universe
Students calculate the density of various astronomical objects and convert them into hydrogen atoms per cubic meter in order to compare
how astronomical objects differ enormously in their densities.
[Grade: 9-12 | Topics: Density=mass/volume; scientific notation; unit conversion; metric math ]
[Click here]
Problem 480: The Expanding Gas Shell of U Camelopardalis
Students explore the expanding U Camelopardalis gas shell imaged by the Hubble Space Telescope, to determine its age and the density of its gas.
[Grade: 6-8 | Topics: Scientific Notation; distance = speed x time; density=mass/volume ]
[Click here]
Problem 439: Chandra Sees a Distant Planet Evaporating
The planet CoRot2b is losing mass at a rate of 5 million tons per second. Students estimate how long it will
take for the planet to lose its atmosphere
[Grade: 6-8 | Topics: Scientific Notation; RAte = Amount/Time]
[Click here]
Problem 416: Kepler probes the interior of red giant stars
Students use the properties of circular arcs to explore sound waves inside stars.
[Grade: 8-10 | Topics: geometry of circles and arcs; distance=speed x time]
[Click here]
Problem 398: The Crab Nebula - Exploring a pulsar up close!
Students work with a photograph to determine its scale and the time taken by light and matter to reach a specified distance from the pulsar.
[Grade: 6-8 | Topics: Scale drawings; unit conversion; distance = speed x time]
[Click here]
Problem 329: WISE and Hubble: Power Functions: A question of magnitude
Students explore the function F(x) = 10^-ax and learn about the stellar magnitude scale used by astronomers to rank the brightness of stars.
[Grade: 10-12 | Topics: base-10, evaluating power functions ] [Click here]
Problem 328: WISE: F(x)G(x): A Tale of Two Functions
Students use WISE satellite data to study a practical application of the product of two finctions by graphing them individually, and their product.
A calculus-level problem is included for advanced students.
[Grade: 10-12 | Topics: Power-law functions; domain and range; graphing; areas under curves; integration] [Click here]
Problem 327: WISE: Exploring Power-law Functions Using WISE Data
Based on a recent press release of the 'First Light' image taken with NASA's new WISE satellite,
students explore a practical application of a power law function to count the number of stars in the sky.
An additional calculus-level problem is included for advanced students.
[Grade: 10-12 | Topics: areas; functions; histograms; unit conversion; power-laws; integration] [Click here]
Problem 322: Rotation Velocity of a Galaxy
Students examine a simple model of the rotation of a galaxy to investigate how fast
stars orbit the centers of galaxies in systems such as the Milky Way and Messier-101.
[Grade: 10-12 | Topics: Algebra, limiting form of functions; derivitives] [Click here]
Problem 320: Star Light...Star Bright
A simple polynomial function is used to determine the temperature of a star from its
brightness at two different visible wavelengths.
[Grade: 10-12 | Topics: Algebra II; Polynomials; maxima and minima] [Click here]
Problem 319: How Many Stars Are In the Sky?
A simple polynomial is used to determine how many stars are in the sky.
[Grade: 10-12 | Topics: Log Functions; Polynomials] [Click here]
Problem 318: The Internal Density and Mass of the Sun
Students use a simple, spherically symmetric, density profile to determine the mass of the sun using integral calculus.
[Grade: 11-12 | Topics: Algebra II; Polynomials; integral calculus] [Click here]
Problem 314: Chandra Studies an Expanding Supernova Shell
Using a millimeter ruler and a sequence of images of a gaseous shell between 2000 and 2005,
students calculate the speed of the material ejected by Supernova 1987A.
[Grade: 6-9 | Topics: Measuring; Metric Units; speed=distance/time] [Click here]
Problem 295: Details from an Exploding Star
Students work with an image from the Hubble Space Telescope of the Crab Nebula to calculate scales and sizes of various features.
[Grade: 6-9 | Topics: Scale; measurement; metric units] [Click here]
Problem 294: Star Cluster math
A simple counting exercise involving star classes lets students work with percentages and ratios.
[Grade: 4-6 | Topics: Counting; percentage; scaling] [Click here]
Problem 284: Calculating the Thickness of a Neutron Star Atmosphere
Students determine the thickness of the carbon atmosphere of the neutron star Cas-A using Earth's
atmosphere and a set of scaling relationships.
[Grade: 9-12 | Topics: Algebra I; Exponential functions; graphing; Scientific notation] [Click here]
Problem 283: Chandra Observatory Sees the Atmosphere of a Neutron Star
Students determine the mass of the carbon atmosphere of the neutron star Cas-A.
[Grade: 8-10 | Topics: Volume of spherical shell; mass = density x volume] [Click here]
Problem 278: Spitzer Studies the Distant Planet Osiris
Students learn about the density of the planet HD209458b, also called Osiris, and compare it to that of Jupiter.
[Grade: 8-10 | Topics: Spherical volumes; density; Scientific Notation;] [Click here]
Problem 269: Parts Per Hundred (pph)
Students work with a common unit to describe the number of objects in a population. Other related quantities are the part-per-thousand, part-per-million and part-per-billion.
[Grade: 3-5 | Topics: counting, unit conversion] [Click here]
Problem 241: Angular Size and Similar Triangles
A critical concept in astronomy is angular size, measured in degrees, minutes or arc-seconds. This is a
review of the basic properties of similar triangles for a fixed angle.
[Grade: 8-10 | Topics: geometry, similar triangles, proportions] [Click here]
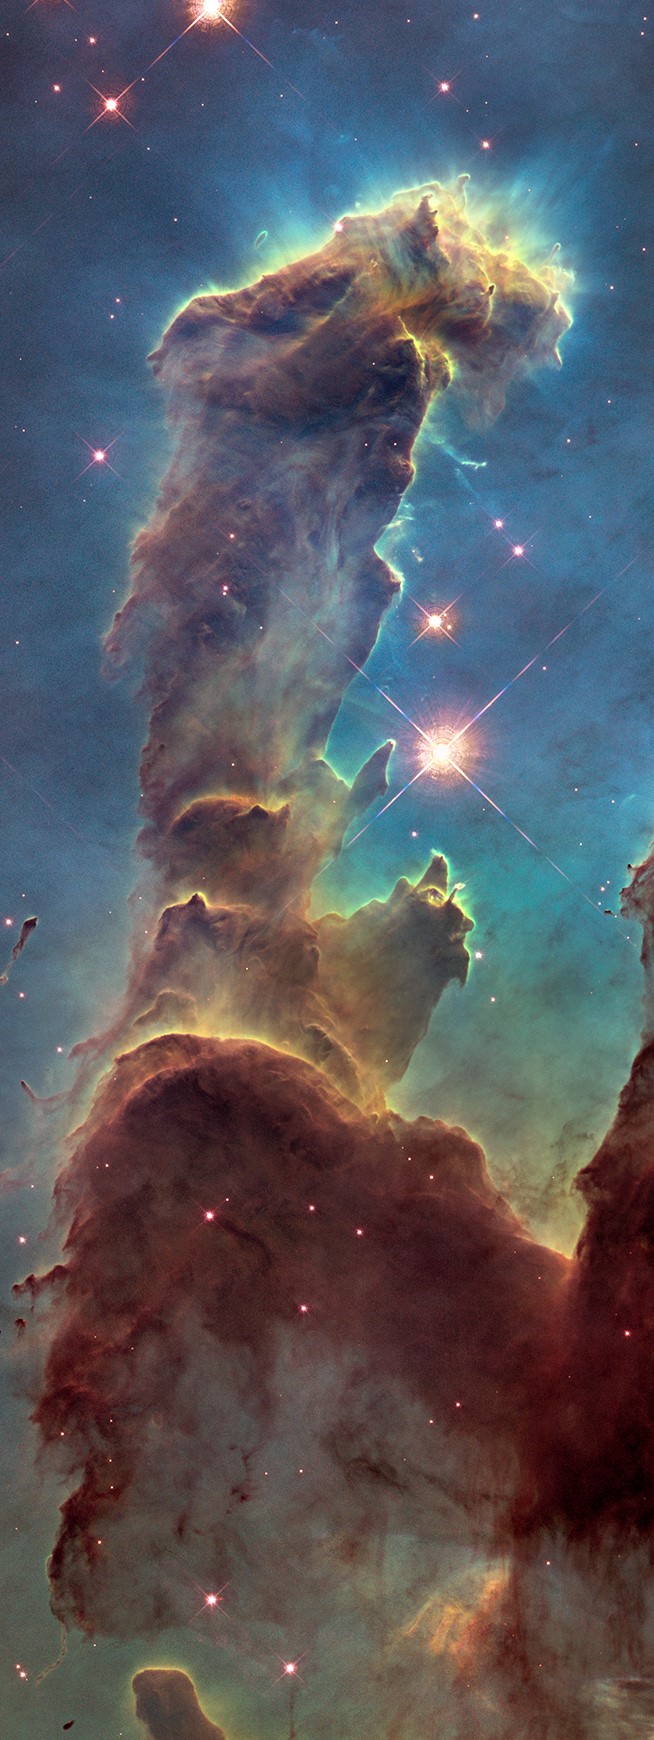
Problem 240: The Eagle Nebula Close-up
Students measure a Hubble image of the famous Eagle Nebula 'Pillars of Creation' to determine the sizes of
various features compared to our solar system
[Grade: 8-10 | Topics: scale, proportion, angle measure] [Click here]
Problem 234: The Hand of Chandra
Students use an image from the Chandra Observatory to measure a pulsar ejecting a cloud of gas.
[Grade: 6-8 | Topics: Scientific Notation; proportions; angle measure] [Click here]
Problem 232: Star Circles-
Students use a photograph of star trails around the North Star Polaris to determine the duration of the timed exposure based on star arc lengths.
[Grade: 8-9 | Topics: Lengths of arcs of circles; angular measure.] [Click here]
Problem 231: Star Magnitudes and Decimals-
Students work with the stellar magnitude scale to determine the brightness differences between stars.
[Grade: 5-8 | Topics: Multiplying decimals.] [Click here]
Problem 224: Perimeters; Which constellation is the longest?-
Students use tabulated data for the angular distances between stars in the Big Dipper and Orion to determine
which constellation has the longest perimeter, and the average star separations.
[Grade: 3-5 | Topics: perimeter of a curve; basic fractions; mixed numbers.] [Click here]
Problem 221: Pulsars and Simple Equations-
Students work with linear equations describing the rotation period of a pulsar, and evaluate the
equations for various conditions. Students use the equations to predict intersection points in time.
[Grade: 6-8 | Topics: Evaluating simple one-variable equations] [Click here]
Problem 213: Kepler: The hunt for Earth-like planets-
Students compare the area of a star with the area of a planet to determine how the star's light
is dimmed when the planet passes across the star as viewed from Earth. This is the basis for the 'transit'
method used by NASA's Kepler satellite to detect new planets.
[Grade: 6-8 | Topics: Area of circle; ratios; percents.] [Click here]
Problem 212: Finding Mass in the Cosmos-
Students derive a simple formula, then use it to determine the masses of objects in the universe from the orbit periods and distances of their satellites.
[Grade: 9-12| Topics: Scientific Notation; Algebra II; parametric equations] [Click here]
Problem 211: Where Did All the Stars Go?-
Students learn why NASA photos often don't show stars because of the way that cameras take pictures of bright and faint objects.
[Grade: 6-8| Topics: multiplication; division; decimal numbers.] [Click here]
Problem 209: How to make faint things stand out in a bright world!-
Students learn that adding images together often enhances faint things not seen in only one image; the power of averaging data.
[Grade: 6-8| Topics: multiplication; division; decimal numbers.] [Click here]
Problem 197: Hubble Sees a Distant Planet-
Students study an image of the dust disk around the star Fomalhaut and determine the orbit period and distance of a newly-discoveblack planet orbiting this young star.
[Grade: 6-10| Topics: Calculating image scales; Circle circumferences; Unit conversions; distance-speed-time] [Click here]
Problem 191: Why are hot things red? -
Students explore the Planck Function using graphing skills, and calculus for experts, to determine the relationship between temperature and peak wavelength.
[Grade: 10-12| Topics: Algebra, graphing, differential calculus] [Click here]
Problem 190: Modeling a Planetary Nebula -
Students use calculus to create a mathematical model of a planetary nebula
[Grade: 10-12| Topics: Algebra, Integral calculus] [Click here]
Problem 189: Stellar Temperature, Size and Power-
Students work with a basic equation to explore the relationship between temperature, surface area and power for a selection of stars.
[Grade: 8-10| Topics: Algebra] [Click here]
Problem 186: Collapsing Gas Clouds and Stability-
Students use the derivative to find an extremum of an equation governing the pressure balance of an interstellar cloud.
[Grade: 11-12| Topics: differentiation; finding extrema; partial derivitives] [Click here]
Problem 182: Our Neighborhood in the Milky Way-
Students create a scale model of the local Milky Way and estimate distances and travel times for a series of voyages.
[Grade: 6-8| Topics: scale models; speed-distance-time] [Click here]
Problem 172: The Stellar Magnitude Scale-
Students learn about positive and negative numbers using a popular brightness scale used by astronomers.
[Grade: 3-6| Topics: number relationships; decimals; negative and positive numbers] [Click here]
Problem 170: Measuring Star Temperatures-
Students use a simple formula to determine the temperatures of stars, and to use a template curve to analyze data for a specific star to estimate its temperature.
[Grade: 6-8 | Topics: algebra, graph analysis] [Click here]
Problem 160: The Relative Sizes of the Sun and Stars-
Students work through a series of comparisons of the relative sizes of the sun compared to other stars, to create a scale model of stellar sizes using simple fractional relationships. ( e.g if Star A is 6 times larger than Star B, and Star C is 1/2 the size of Star B, how big is Star C in terms of Star A?)
[Grade: 4-6 | Topics: working with fractions; scale models] [Click here]
Problem 158: The Solar Neighborhod within 17 Light Years -
Students create a scale model of the local solar neighborhood and determine the shortest travel distances to several stars.
[Grade: 6-8 | Topics: Plotting polar coordinates using a ruler and compass; decimal math] [Click here]
Problem 156: Spectral Classification of Stars-
Students use actual star spectra to classify them into specific spectral types according to a standard ruberic.
[Grade: 5-8 | Topics: Working with patterns in data; simple sorting logic] [Click here]
Problem 148
Exploring a Dying Star
Students use data from the Spitzer satellite to calculate the mass of a planetary nebula from a dying star.
[Grade: 9 - 11 | Topics:Scientific Notation; unit conversions; volume of a sphere ] [Click here]
Problem 147
Black hole - fade out
Students calculate how long it takes light to fade away as an
object falls into a black hole. [Grade: 9 - 11 | Topics: Scientific Notation; exponential functions] [Click here]
Problem 146
Black Hole Power
Students calculate how much power is produced as matter falls into a rotating and
a non-rotating black hole including solar and supermassive black holes.
[Grade: 9 - 11 | Topics:Scientific Notation; Spherical shells; density; power] [Click here]
Problem 145
Black Holes - What's Inside?
Students work with the Pythagorean Theorem for black holes and investigate what
happens to space and time on the other side of an Event Horizon. [Grade:9 - 11 | Topics: Scientific Notation; distance; time calculations; algebra] [Click here]
Problem 144
Exploring Angular Size
Students examine the concept of angular size and how it relates to the physical size of
an object and its distance. A Chandra Satellite x-ray image of the star cluster NGC-6266 is used, along with its distance, to
determine how far apart the stars are based on their angular separations.
[Grade: 7 - 10 | Topics:Scientific Notation; degree measurement; physical size=distance x angular size.] [Click here]
Problem 142
Black Holes---Part VIII
Matter that falls into a black hole heats up in an accretion disk,
which can emit x-rays and even gamma rays visible from Earth. In this problem,
students use a simple algebraic formula to calculate the temperature at various
places in an accretion disk.
[Grade: 7 - 10 | Topics:Scientific Notation; Working with equations in one variable to first and second power.] [Click here]
Problem 141
Exploring a Dusty Young Star
Students use Spitzer satellite data to learn about how dust emits infrared light and
calculate the mass of dust grains from a young star in the nebula NGC-7129.
[Grade: 4 - 7 | Topics: Algebra I; multiplication, division; scientific notation] [Click here]
Problem 140
Black Holes---Part VII
If you fell into a black hole, how fast would you be traveling? Students use a simple equation to calculate the free-fall
speed as they pass through the event horizon.
[Grade: 7 - 10 | Topics:Scientific Notation; Working with equations in one variable to first and second power.] [Click here]
Problem 138
Black Holes---Part VI
Tidal forces are an important gravity phenomenon, but they can be lethal to humans
in the vicinity of black holes. This exercise lets students calculate the tidal acceleration between your head and feet
while standing on the surface of Earth...and falling into a black hole.
[Grade: 7 - 10 | Topics:Scientific Notation; Working with equations in one variable to first and second power.] [Click here]
Problem 137
Black Holes---Part V
Students explore how Kepler's Third Law can be used to
determine the mass of a black hole, or the mass of the North Star: Polaris.
[Grade: 7 - 10 | Topics:Scientific Notation; Working with equations in one variable to first and second power.] [Click here]
Problem 136
Black Holes---Part IV
Students explore how much energy is generated by stars
and gas falling into black holes. The event horizon radius is calculated from a
simple equation, R = 2.95 M, and energy is estimated from E = mc^2.
[Grade: 7 - 10 | Topics:Scientific Notation; Working with equations in one variable to first and second power.] [Click here]
Problem 132
Black Holes - III
Students learn about how gravity distorts time near a black hole and other massive bodies.
[Grade: 8 - 12 | Topics:Simple linear equations; scientific notation] [Click here]
Problem 131
How Big is It? - Las Vegas up close.
Students work with an image taken by the QuickBird imaging satellite of downtown Las Vegas, Nevada. They
determine the image scale, and calculate the sizes of streets, cars and buildings from the image.
[Grade: 4 - 7 | Topics:image scaling; multiply, divide, work with millimeter ruler] [Click here]
Problem 130
Black Holes - II
Students learn about how gravity distorts time and
causes problems even for the
Global Positioning System satellites and their timing signals.
[Grade: 8 - 12 | Topics:Simple linear equations; scientific notation] [Click here]
Problem 128
Black Holes - I
Students learn about the most basic component to a black hole - the event horizon. Using a simple formula, and scientific notation, they
examine the sizes of various kinds of black holes.
[Grade: 8 - 12 | Topics:Simple linear equations; scientific notation] [Click here]
Problem 115
A Mathematical Model of the Sun
Students will use the formula for a sphere and a shell to calculate the mass of the
sun for various choices of its density. The goal is to reproduce the measured mass and radius of the sun by
a careful selection of its density in a core region and a shell region. Students will manipulate the values for density and shell size to
achieve the correct total mass. This can be done by hand, or by programming
an Excel spreadsheet.
[Grade: 8-10 | Topics: scientific notation; volume of a sphere and a spherical shell; density, mass and volume.] [Click here]
Problem 62
Star light...Star bright - A question of magnitude! -
Since the time of the ancient Greek astronomer Hipparchus, astronomers have measured and cataloged the brightness of stars
according to the 'apparent magnitude scale'. This activity lets students experience this peculiar numbering system
where bright stars have small numbers (even negative: our sun is a -26 magnitude!) and faint stars have large numbers
(faintest stars are +29 magnitudes). Students will calculate the
brightness differences between stars using multiplication and division. Working with the number line will be a big
help and math review!
[Grade level: 4-6 | Topics: Positive and negative numbers; decimal math] [Click here]
Problem 61
Drake's Equation and the Search for Life...sort of! -
In the 1960's astronomer Frank Drake invented an equation
that helps us estimate how much life, especially the intelligent kind, might exist in our Milky Way. It has
been a lively topic of discussion in thousands of college astronomy courses for the last 30 years. In this simplified version,
your students will get to review what we now know about the planetary universe, and come up with their own
estimates. The real fun is in doing the research to track down plausible values (or their ranges) for the factors that
enter into the equation, and then write a defense for the values that they choose. Lots of opportunity to summarize basic astronomical knowledge towards
the end of an astronomy course, or chapter.
[Grade level: 6-8 | Topics: decimal math; evaluating functions for given values of variables] [Click here]
Problem 58
How many stars are there? -
For thousands of years, astronomers have counted the stars to
determine just how vast the heavens are. Since the 19th century, 'star gauging' has been
an important
tool for astronomers to assess how the various populations of stars are distributed within
the Milky Way. In this activity, students will get their first taste of star counting by
using a star atlas reproduction and bar-graph the numbers of stars in each magnitude interval.
They will then calculate the number of similar stars in the sky by scaling up their counts to the full
sky area.
[Grade level: 6-8 | Topics: Positive and negative numbers; histogramming; extrapolating data] [Click here]
Problem 53
Astronomy: A Moving Experience! -
Objects in space move. To figure out how fast they move,
astronomers use many different techniques depending on what they are investigating.
In this activity, you will measure the speed of astronomical phenomena using the scaling
clues and the time intervals between photographs of three phenomena: A supernova
explosion, a coronal mass ejection, and a solar flare shock wave.
[Grade level: 6-8 | Topics: Finding the scale of an image; metric measurement; distance = speed x time; scientific notation] [Click here]
Problem 52
Measuring the size of a Star Cluster -
Astronomers often use a photograph to determine the size of astronomical objects. The
Pleiades is a famous cluster of hundreds of bright stars. In this activity, students will determine the photographic scale,
and use
this to estimate the projected (2-D) distances between the stars in this cluster. They will also use internet and library resources to learn more about this
cluster.
[Grade level: 4-6 | Topics: Online research; Finding the scale of an image; metric measurement; decimal math] [Click here]
Problem 47
Discovering the Milky Way by Counting Stars. -
It is common to say that there are about 8,000 stars visible to the naked eye in
both hemispheres of the sky, although from a typical urban setting, fewer
than 500 stars are actually visible. Students will use data from a deep-integration image of a
region of the sky in Hercules, observed by the 2MASS sky survey project to estimate the number
of stars in the sky. This number is a lower-limit to the roughly 250 to 500 billion stars that
may actually exist in the Milky Way.
[Grade level: 4-6 | Topics: Tallying data; decimal math] [Click here]
Problem 44
Interstellar Distances with the Pythagorean Theorem -
If you select any two stars in the sky and calculate how far apart they are,
you may discover that even stars that appear to be far apart are actually close neighbors in space. This activity
lets students use the Pythagorean distance formula in 3-dimensions to explore stellar
distances for a collection of bright stars, first as seen from Earth and then as seen from a planet
orbiting the star Polaris. Requires a calculator and some familiarity with algebra and square-roots.
[Grade level: 9-11 | Topics: Decimal math; Pythagorean Theorem; square root] [Click here]