Books from SpaceMath

Black Hole Math (2012: 53 Problems) This book provides an introduction to the basic properties of black holes using elementary algebra and geometry. Students calculate black hole sizes from their mass, time and space distortion, learn about world lines, light cones and simple spacetime diagrams, and explore the impact that black holes have upon their surroundings. [Click here]
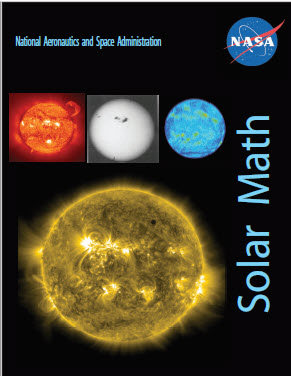
Solar Math (2012: 99 Problems
This book features problems about the sun from many NASA science missions.
The activities explore solar storms and solar structure using simple math activities. Problems range from calculating the sizes of sunspots from photographs,
to investigating solar magnetism, the sunspot cycle, and solar storms using algebra and geometry. Suitable for students in grades 6-12.
[Click here]
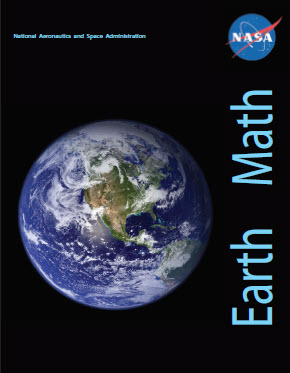
Earth Math (2009: 46 Problems Students explore the simple mathematics behind global climate change through analyzing graphical data, data from NASA satellites, and by performing simple calculations of carbon usage using home electric bills and national and international energy consumption. [Click here]
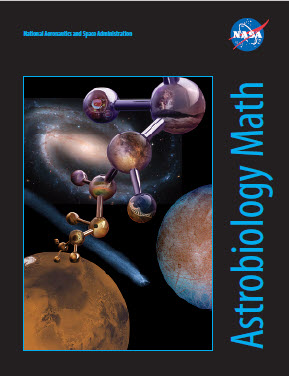
Astrobiology Math (2011: 75 Problems This book introduces many topics in the emerging subject of astrobiology: The search for life beyond Earth. It covers concepts in evolution, the detection of extra-solar planets, habitability, Drake's Equation, and the properties of planets such as temperature and distance from their star. [Click here]
Properties of Numbers
Problem 209: How to make faint things stand out in a bright world!- Students learn that adding images together often enhances faint things not seen in only one image; the power of averaging data. [Grade: 6-8| Topics: multiplication; division; decimal numbers.] [Click here]
Problem 64 Solar Activity and Satellite Mathematics - When solar storms cause satellite problems, they can also cause satellites to lose money. The biggest source of revenue from communications satellites comes from transponders that relay television programs, ATM transactions and many other vital forms of information. They are rented to many different customers and can cost nearly $2 million a year for each transponder. This activity examines what happens to a single satellite when space weather turns bad! [Grade level: 4-6 | Topics: Decimals; money; percents] [Click here]
Working With Simple Equations
Problem 222: Kelvin Temperatures and Very Cold Things- Students convert from Celsius to Fahrenheit and to Kelvin using three linear equations. [Grade: 5-8 | Topics: Evaluating simple linear equations for given values..] [Click here]
Problem 221: Pulsars and Simple Equations- Students work with linear equations describing the rotation period of a pulsar, and evaluate the equations for various conditions. Students use the equations to predict intersection points in time. [Grade: 6-8 | Topics: Evaluating simple one-variable equations] [Click here]
Problem 219: Variables and Expressions from Around the Cosmos- Students evaluate linear equations describing a variety of astronomical situations. [Grade: 6-8 | Topics: Evaluating simple one-variable equations.] [Click here]
Problem 206: Can You Hear me now? - Students learn about how the transmission of data is affected by how far away a satellite is, for a variety of spacecraft in the solar system [Grade: 6-8| Topics: multiplication; division; decimal numbers.] [Click here]
Problem 203: Light Travel Times- Students determine the time it takes light to reach various objects in space. [Grade: 6-8| Topics: Scientific Notation; Multiplication; time = distance/speed.] [Click here]
Problem 164: Equations with One Variable- Students work with equations like '4.3 = 3.26D' to solve for D in a number of simple astronomical problems involving distances, speed and temperature conversion. [Grade: 6-8 | Topics: equations in one variable; multiplication; division; decimals] [Click here]
Problem 61 Drake's Equation and the Search for Life...sort of! - Way back in the 1960's astronomer Frank Drake invented an equation that helps us estimate how much life, especially the intelligent kind, might exist in our Milky Way. It has been a lively topic of discussion in thousands of college astronomy courses for the last 60 years. In this simplified version, your students will get to review what we now know about the planetary universe, and come up with their own estimates. The real fun is in doing the research to track down plausible values (or their ranges) for the factors that enter into the equation, and then write a defense for the values that they choose. Lots of opportunity to summarize basic astronomical knowledge towards the end of an astronomy course, or chapter. [Grade level: 6-8 | Topics: decimal math; evaluating functions for given values of variables] [Click here]
Rates and Slopes
Problem 671:VAB - The Van Allen Probes and Radiation Dose Students study radiation dose units and estimate the exposures for a human living on the ground; an astronaut in the ISS, and the Van Allen belt environment. [Grade: 8-10 | Topics: Unit conversion; rates] [Click here]
Problem 227: Working With Rates- Students examine mixed rates for a variety of situations and their connections to ratios. [Grade: 6-8 | Topics: Ratios; scientific notation; unit conversion.] [Click here]
Problem 226: Rates and Slopes: An astronomical perspective- Students determine the slopes for two linear graphs and make the connection to rates with mixed units. [Grade: 7-9 | Topics: Finding the slope of a linear graph.] [Click here]
Problem 65 A Perspective on Radiation Dosages - Depending on the kind of career you chose, you will experience different lifetime radiation dosages. This problem compares the cumulative dosages for someone living on Earth, an astronaut career involving travel to the Space Station, and the lifetime dosage of someone traveling to Mars and back. [Grade level: 6-8 | Topics: decimals, unit conversions, graphing a timeline, finding areas under curves using rectangles] [Click here]
Problem 134 The Last Total Solar Eclipse--Ever! Students explore the geometry required for a total solar eclipse, and estimate how many years into the future the last total solar eclipse will occur as the moon slowly recedes from Earth by three centimeters/year. [Grade: 7 - 10 | Topics:Simple linear equations] [Click here]
Interpreting and Working with Graphs
Problem 225: Areas Under Curves; An astronomical perspective- Students work with a bar graph of the number of exoplanet discoveries since 1995 to evaluate the total discoveries, as areas under the graph, for various combinations of time periods. [Grade: 6-8 | Topics: Adding areas in bar graphs.] [Click here]
Problem 100 The Sunspot Cycle - endings and beginnings - Students will examine a plot of the sunspot cycle and extract information from the plotted data about the previous sunspot cycle, and make predictions about the next one about to start in 2007. [Grade level: 6-9 | Topics:graph reading; extrapolation; time calculations] [Click here]
Problem 54 Exploring Distant Galaxies - Astronomers determine the redshifts of distant galaxies by using spectra and measuring the wavelength shifts for familiar atomic lines. The larger the redshift, denoted by the letter Z, the more distant the galaxy. In this activity, students will use an actual image of a distant corner of the universe, with the redshifts of galaxies identified. After histogramming the redshift distribution, they will use an on-line cosmology calculator to determine the 'look-back' times for the galaxies and find the one that is the most ancient galaxy in the field. Can students find a galaxy formed only 500 million years after the Big Bang? [Grade level: 9-11 | Topics: Decimal math; using an online calculator; Histogramming data] [Click here]
Problem 1 Magnetic Storms I Students learn about magnetic storms using real data in the form of a line graph. They answer simple questions about data range, maximum, and minimum. [Grade: 7 - 9 | Topics: Interpreting a graph; time calculations] [Click here]
Problem 36 The Space Station Orbit Decay and Space Weather Students will learn about the continued decay of the orbit of the International Space Station by studying a graph of the Station's altitude versus time. They will calculate the orbit decay rates, and investigate why this might be happening. [Grade: 5 - 8 | Topics: Interpreting graphical data; decimal math] [Click here]
Proportions and Scales
Problem 261: LRO - Searching for Lunar boulders Students use a recent image of the Apollo-11 landing area to search for large lunar boulders. [Grade: 6-8 | Topics: scale, ratio, proportion] [Click here]
Problem 57 Asteroids and comets and meteors - Oh My! - Astronomers have determined the orbits for over 30,000 minor planets in the solar system, with hundreds of new ones discovered every year. Working from a map of the locations of these bodies within the orbit of Mars, students will calculate the scale of the map, and answer questions about the distances between these objects, and the number that cross earth's orbit. A great, hands-on introduction to asteroids in the inner solar system! Links to online data bases for further inquiry are also provided. [Grade level: 4-6 | Topics: Scale model; Decimal math; Interpreting 2-D graph] [Click here]
Problem 49 A Spiral Galaxy Up Close. - Astronomers can learn a lot from studying photographs of galaxies. In this activity, students will compute the image scale (light years per millimeter) in a photograph of a nearby spiral galaxy, and explore the sizes of the features found in the image. They will also use the internet or other resources to fill-in the missing background information about this galaxy. [Grade level: 6-8 | Topics: Online research; Finding the scale of an image; metric measurement; decimal math] [Click here]
Speed and Distance
Problem 102 How fast does the sun rotate? Students will analyze consecutive images taken by the Hinode satellite to determine the sun's speed of rotation, and the approximate length of its 'day'. [Grade: 6-9 | Topics:image scales; time calculations; speed calculations, unit conversions] [Click here]
Problem 101 Super-Fast Solar Flares!! - Students will analyze consecutive images taken of an erupting solar flare, and use the information provided to calculate the speed of the flare. [Grade level: 6-9 | Topics:image scales; time calculations; speed calculations] [Click here]
Problem 80 Data Corruption by High Energy Particles - Students will see how solar flares can corrupt satellite data, and create a timeline for a spectacular episode of data loss recorded by the SOHO satellite using images obtained by the satellite. Students will also calculate the speed of the event as particles are ejected from the sun and streak towards earth. [Grade level: 6-8 | Topics: Time and speed calculations; interpreting scientific data ] [Click here]
Problem 43 An Interplanetary Shock Wave On November 8, 2000 the sun released a coronal mass ejection that traveled to Earth, and its effects were detected on Jupiter and Saturn several weeks later. In this problem, students will use data from this storm to track its speed and acceleration as it traveled across the solar system. [Grade level: 6-10 | Topics: Time calculations; distance = speed x time ] [Click here]
Problem 53 Astronomy: A Moving Experience! - Objects in space move. To figure out how fast they move, astronomers use many different techniques depending on what they are investigating. In this activity, you will measure the speed of astronomical phenomena using the scaling clues and the time intervals between photographs of three phenomena: A supernova explosion, a coronal mass ejection, and a solar flare shock wave. [Grade level: 6-8 | Topics: Finding the scale of an image; metric measurement; distance = speed x time; scientific notation] [Click here]
Geometry
Problem 41 Solar Energy in Space Students will calculate the area of a satellite's surface being used for solar cells from an actual photo of the IMAGE satellite. They will calculate the electrical power provided by this one panel. Students will have to calculate the area of an irregular region using nested rectangles. [Grade level: 7-10 | Topics: Area of an irregular polygon; decimal math] [Click here]
Problem 247: Space Mobile Puzzle Students calculate the missing masses and lengths in a mobile using the basic balance equation m1 x r1 = m2 x r2 for a solar system mobile. [Grade: 6-8 | Topics: metric measure, algebra 1, geometry] [Click here]
Problem 245: Solid Rocket Boosters Students learn how SRBs actually create thrust, and study the Ares-V booster to estimate its thrust. [Grade: 6-8 | Topics: volume, area, unit conversions] [Click here]
Data Analysis and Probability
Problem 262: LRO Explore Lunar Surface Cratering Students count the number of craters in various size ranges from a high-resolution image of the lunar surface. [Grade: 6-8 | Topics: scale, proportion, ratio, area, density] [Click here]
Problem 253: NASA 'Sees' Carbon Dioxide A satellite image of atmospheric carbon dioxide is used to estimate the geographic differences and identify human activity. [Grade: 6-8 | Topics: interpreting a data image, unit conversion, gigatons ] [Click here]
Problem 252: Carbon Dioxide Increases Students study the Keeling Curve to determine the rates of increase of carbon dioxide in the atmosphere. [Grade: 6-8 | Topics: graph analysis, slope, rates, unit conversion, parts-per-million, gigatons] [Click here]
Problem 211: Where Did All the Stars Go?- Students learn why NASA photos often don't show stars because of the way that cameras take pictures of bright and faint objects. [Grade: 6-8| Topics: multiplication; division; decimal numbers.] [Click here]
Problem 194: A Magnetic Case for 'What Came First?' - Students create a timeline for events based on several data plots from the THEMIS program, and use their timeline to answer questions about the causes of magnetic storms. [Grade: 6-8| Topics: Time calculations] [Click here]
Problem 185: The International Space Station: Follow that graph!- Students use a plot of the orbit altitude of the ISS to predict its re-entry year after the peak of the next solar activity cycle. [Grade: 6-8| Topics: extrapolating a simple graph; estimation; forecasting] [Click here]
Problem 152: The Hubble Law - Students plot the speed and distance to 7 galaxies and by deriving the slope of the linear model for the data points, obtain an estimate for the expansion rate of the universe known as Hubble's Constant. [Grade: 6-8 | Topics: Plotting data; determining the slope of the data;] [Click here]
Problem 120 Benford's Law Students will explore a relationship called Benford's Law, which describes the frequency of the integers 1-9 in various data. This law is used by the IRS to catch fradulent tax returns, but also applies to astronomical data and other surprising situations. [Grade: 8-10 | Topics:Calculating frequency tables; Histogramming; Statistics] [Click here]
Problem 95 A Study on Astronaut Radiation Dosages in SPace - Students will examine a graph of the astronaut radiation dosages for Space Shuttle flights, and estimate the total dosages for astronauts working on the International Space Station. [Grade level: 9-11 | Topics:Graph analysis, interpolation, unit conversion] [Click here]
Problem 94 Solar Storms: Odds, Fractions and Percentages - Students will use actual data on solar storms to learn about the different kinds of storms and how common they are. This is a basic science activity that professionals do in order to look for relationships between different kinds of events that might lead to clues about what causes them. Can your students come up with something new that noone has thought about before? The Venn Diagramming activity is a key element of the activity and is reasonably challenging! [Grade level: 6-8 | Topics: Averaging; fractions; percentages; odds; Arithmetic Operations; Venn Diagrams] [Click here]
Problem 90 A Career in Astronomy - This problem looks at some of the statistics of working in a field like astronomy. Students will read graphs and answer questions about the number of astronomers in this job area, and the rate of increase in the population size and number of advanced degrees. [Grade level: 6-8 | Topics: graph reading; percentages; interpolation] [Click here]
Problem 86 Do Fast CMEs Produce SPEs? - Recent data on solar proton storms (SPEs) and coronal mass ejections (CMEs) are compared using Venn Diagrams to see if the speed of a CME makes solar proton storms more likely or not. [Grade level: 5-8 | Topics: Venn Diagrams; counting; calculating percentages and odds] [Click here]
Problem 85 The Solar Tsunami! - Recent data from the Hinode satellite is used to measure the speed of a solar explosion on the surface of the sun using a series of images taken by the satellite at three different times. Students calculate the speed of the blast between the first pair and last pair of images, and determine if the blast wave was accelerating or decelerating in time. [Grade level: 5-8 | Topics: Finding image scale; calculating time differences; calculating speed from distance and time] [Click here]
Problem 70 Calculating Total Radiation Dosages at Mars - This problem uses data from the Mars Radiation Environment Experiment (MARIE) which is orbiting Mars, and measures the daily radiation dosage that an astronaut would experience in orbit around Mars. Students will use actual plotted data to calculate the total dosage by adding up the areas under the data curve. This requires knowledge of the area of a rectangle, and an appreciation of the fact that the product of a rate (rems per day) times the time duration (days) gives a total dose (Rems), much like the product of speed times time gives distance. Both represent the areas under their appropriate curves. Students will calculate the dosages for cosmic radiation and solar proton flares, and decide which component produces the most severe radiation problem. [Grade level: 6-8 | Topics: decimals, area of rectangle, graph analysis] [Click here]
Problem 32 Solar Proton Events and Satellite Damage Students will examine the statistics for Solar Proton Events since 1996 and estimate their damage to satellite solar power systems. [Grade: 7 - 9 | Topics: Interpreting tabular data; histogramming] [Click here]
Problem 28 Satellite Power and Cosmic Rays Most satellites operate by using solar cells to generate electricity. But after years in orbit, these solar cells produce less electricity because of the steady impact of cosmic rays. In this activity, students read a graph that shows the electricity produced by a satellite's solar panels, and learn a valuable lesson about how to design satellites for long-term operation in space. Basic math ideas: Area calculation, unit conversions, extrapolation and interpolation of graph trends. [Grade: 6 - 8 | Topics: Interpreting graphical data; decimal math] [Click here]
Problem 27 Satellite Failures and the Sunspot Cycle There are over 1500 working satellites orbiting Earth, representing an investment of 160 billion dollars. Every year, between 10 and 30 of these re-enter the atmosphere. In this problem, students compare the sunspot cycle with the record of satellites re-entering the atmosphere and determine if there is a correlation. They also investigate how pervasive satellite technology has become in their daily lives. [Grade: 6 - 8 | Topics: Graphing tabular data; decimal math] [Click here]
Problem 9 Aurora Power! Students use data to estimate the power of an aurora, and compare it to common things such as the electrical consumption of a house, a city and a country. [Grade: 5 - 7 | Topics: Interpreting tabular data] [Click here]
Problem 7 Solar Flares, CME's and Aurora Some articles about the Northern Lights imply that solar flares cause them. Students will use data to construct a simple Venn Diagram, and answer an important question about whether solar flares cause CME's and Aurora. [Grade: 5 - 7 | Topics: Venn Diagramming] [Click here]
Problem Solving
Problem 377: Deep Impact: Approaching Comet Hartley-2
Students use data for the brightness of Comet Hartley-2 measured by the Deep Impact spacecraft to create a linear equation for its approach distance,
and use the inverse-square law to estimate its brightness on October 13, 2010.
[Grade: 8-10 | Topics: linear modeling from data; inverse-square law]
[Click here]
Problem 238: Satellite Drag and the Hubble Space Telescope Satellite experience drag with the atmosphere, which eventually causes them to burn up in the atmosphere. Students study various forecasts of the altitude of the Hubble Space Telescope to estimate its re-entry year. [Grade: 6-8 | Topics: interpreting graphical data; predicting trends] [Click here]
Problem 211: Where Did All the Stars Go?- Students learn why NASA photos often don't show stars because of the way that cameras take pictures of bright and faint objects. [Grade: 6-8| Topics: multiplication; division; decimal numbers.] [Click here]
Problem 124 The Moon's Atmosphere! Students learn about the moon's very thin atmosphere by calculating its total mass in kilograms using the volume of a spherical shell and the measured density. [Grade: 8-10 | Topics:volume of sphere, shell; density-mass-volume; unit conversions] [Click here]
Problem 95 A Study on Astronaut Radiation Dosages in Space - Students will examine a graph of the astronaut radiation dosages for Space Shuttle flights, and estimate the total dosages for astronauts working on the International Space Station. [Grade level: 9-11 | Topics:Graph analysis, interpolation, unit conversion] [Click here]
Problem 83 Luner Meteorite Impact Risks - In 2006, scientists identified 12 flashes of light on the moon that were probably meteorite impacts. They estimated that these meteorites were probably about the size of a grapefruit. How long would lunar colonists have to wait before seeing such a flash within their horizon? Students will use an area and probability calculation to discover the average waiting time. [Grade level: 8-10 | Topics: arithmetic; unit conversions; surface area of a sphere ] [Click here]
Problem 74 A Hot Time on Mars - The NASA Mars Radiation Environment (MARIE) experiment has created a map of the surface of mars, and measured the ground-level radiation background that astronauts would be exposed to. This math problem lets students examine the total radiation dosage that these explorers would receive on a series of 1000 km journeys across the martian surface. The students will compare this dosage to typical background conditions on earth and in the International Space Station to get a sense of perspective [Grade level: 6-8 | Topics: decimals, unit conversion, graphing and analysis ] [Click here]
Problem 71 Are the Van Allen Belts Really Deadly? - This problem explores the radiation dosages that astronauts would receive as they travel through the van Allen Belts enroute to the Moon. Students will use data to calculate the duration of the trip through the belts, and the total received dosage, and compare this to a lethal dosage to confront a misconception that Apollo astronauts would have instantly died on their trip to the Moon. [Grade level: 8-10 | Topics: decimals, area of rectangle, graph analysis] [Click here]
Problem 68 An Introduction to Space Radiation - Read about your natural background radiation dosages, learn about Rems and Rads, and the difference between low-level dosages and high-level dosages. Students use basic math operations to calculate total dosages from dosage rates, and calculating cancer risks. [Grade level: 6-8 | Topics: Reading to be Informed; decimals, fractions, square-roots] [Click here]
Problem 66 Background Radiation and Lifestyles - Living on Earth, you will be subjected to many different radiation environments. This problem follows one person through four different possible futures, and compares the cumulative lifetime dosages. [Grade level: 6-8 | Topics: fractions, decimals, unit conversions] [Click here]
NASA’s STEAM Innovation Lab is a think tank with an emphasis on space science content applications.