|
Exploring Global Climate Change |
||||||||
|
|||||||||
 |

Mathematics Skill or Topic Area:
Graphing Functions
Next Gen Science Framework: PS1: Matter and Its Interactions, PS3: Energy, LS2: Ecosystems: Interactions, Energy, and Dynamics, ESS2.A: Earth Materials and Systems, ESS3.C: Human Impacts on Earth Systems, ESS3.D: Global Climate Change, ETS2: Links Among Engineering, Technology, Science, and Society
Common Core ELA for Science: RST.6-8.2. Determine the central ideas or conclusions of a text; provide an accurate summary of the text distinct from prior knowledge or opinions. RST.6-8.8. Distinguish among facts, reasoned judgment based on research findings, and speculation in a text. RST.6-8.9. Compare and contrast the information gained from experiments, simulations, video, or multimedia sources with that gained from reading a text on the same topic.
Common Core Math Standard: 6.EE.2.c Evaluate expressions at specific values of their variables. Include expressions that arise from formulas used in real-world problems. Perform arithmetic operations, including those involving whole-number exponents, in the conventional order when there are no parentheses to specify a particular order (Order of Operations); 6.EE.6 Use variables to represent numbers and write expressions when solving a real-world or mathematical problem; understand that a variable can represent an unknown number, or, depending on the purpose at hand, any number in a specified set; 6.EE.7 Solve real-world and mathematical problems by writing and solving equations of the form x + p = q and px = q for cases in which p, q and x are all nonnegative rational numbers.

Video Engagement: NASA and Biosphere 2 Visit Biosphere 2, operated by the University of Arizona, to find out how scientists are working with NASA to discover more about the effects of global climate change could have on key biomes. Learn about the characteristics that divide Earth into unique terrestrial biomes. (6 minutes) View Program
|
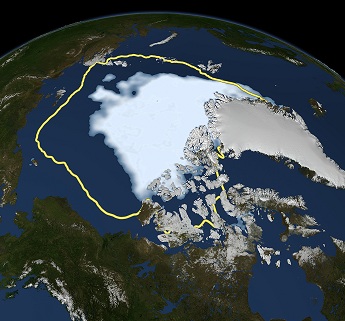
Engage your students with a press release: Arctic Sea Ice Hits Smallest Extent In Satellite Era
The frozen cap of the Arctic Ocean appears to have reached its annual summertime smallest extent. This time it broke a new record on September 16,2012. Scientists studying satellite data have shown that the minimum sea ice extent has shrunk to 1.32 million square miles (3.41 million square kilometers).
The new record minimum is almost 300,000 square miles less than the previous record, set in 2007.The state of Texas measures around 268,600 square miles in area.
Although September 16 seems to be the annual minimum, there's still time for winds to change and compact the ice floes.
Arctic sea ice cover naturally grows during the dark Arctic winters when it's cold. Sea ice retreats when the sun re-appears in the spring. The sea ice minimum area is normally reached in September. The problem is that it has been decreasing over the last three decades as Arctic ocean and air temperatures have increased. This year's minimum area marks the first time Arctic sea ice has dipped below 4 million square kilometers in total area.
"Climate models have predicted a retreat of the Arctic sea ice .The actual retreat has proven to be much more rapid than the predictions," said Claire Parkinson, a climate scientist at NASA Goddard Space Flight Center. The thickness of the ice cover is also in decline.
The disappearing older ice gets replaced in winter with thinner seasonal ice that usually melts completely in the summer.
Press release date line - September 19, 2012 [ Click Here ] Other Press Releases: |
|
Explore
math connections with SpaceMath@NASA
Problem I -
Global Warming Trends -
A combination of hundreds of climate studies have traced changes in the average temperature of Earth since before the Industrial
Revolution in the 1800's.
Students will graph and interpret data over the period from 1960 to 2050.
[Open PDF ]
Problem II -
Carbon Dioxide Change
-
As humans continue to burn fossil fuels, the amount of carbon dioxide in the atmosphere changes. Students will use a simple mathematical model to make predictions about carbon dioxide abundances.
[Open PDF ]
Explain
your thinking: Write
your own problem - Using information
found in the Math Connection problems, the press release or the video
program, create your own math problem. Explain why you set the problem up this
way, and how you might find its answer.
Evaluate
your understanding: Challenge Problem
- As global temperatures increase, water expands, and so the volume of the world's oceans will steadily increase in time. This causes the sea level to increase. Students will use
a simple function to analyze changes in sea level. [Open PDF ]

NASA / JPL
3-D Solar System
Extend your new knowledge - Satellites keep track of sea level and changes in Earth's temperature. Explore satellite orbit periods. [ Open PDF ]