|
Exploring Global Climate Change from 1900 to 2010 |
||||||||
|
|||||||||
 |

Mathematics Skill or Topic Area:
Interpreting Graphs, Slopes and Rates of Change
Next Gen Science Standards PS3: Energy; ETS 2: Links among Engineering, Technology, Science, and Society
Common Core ELA for Science: RST.6-8.2. Determine the central ideas or conclusions of a text; provide an accurate summary of the text distinct from prior knowledge or opinions.RST.6-8.8. Distinguish among facts, reasoned judgment based on research findings, and speculation in a text. RST.6-8.9. Compare and contrast the information gained from experiments, simulations, video, or multimedia sources with that gained from reading a text on the same topic.
Common Core Math Standard: CC.8.EE.5. Graph proportional relationships, interpreting the unit rate as the slope of the graph.

Video Engagement: Monitoring Earth's Energy Budget with CERES Learn how NASA uses a data-collecting sensor, Clouds and Earths Radiant Energy System, or CERES, to study clouds and make accurate measurements of energy leaving Earth (4 minutes). View Program
|
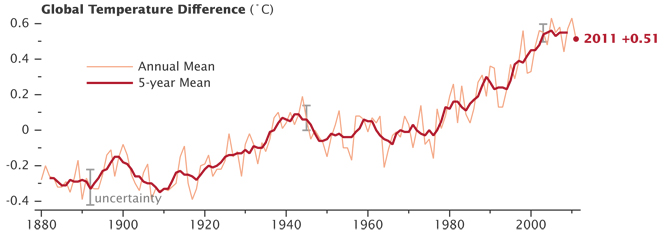
Engage your students with a press release: NASA Finds 2011 Ninth-Warmest Year on Record
The global average surface temperature in 2011 was the ninth warmest since 1880, according to NASA scientists. The finding continues a
trend in which nine of the 10 warmest years in the modern meteorological record have occurred since the year 2000.
NASA's Goddard Institute for Space Studies (GISS) in New York, which monitors global surface temperatures on an ongoing basis,
released an updated analysis that shows temperatures around the globe in 2011 compared to the average global temperature from the
mid-20th century. The comparison shows how Earth continues to experience warmer temperatures than several decades ago.
The average temperature around the globe in 2011 was 0.92 degrees F (0.51 C) warmer than the mid-20th century baseline.
"We know the planet is absorbing more energy than it is emitting," said GISS Director James E. Hansen. "So we are continuing to
see a trend toward higher temperatures. Even with the cooling effects of a strong La Nina influence and low solar activity for
the past several years, 2011 was one of the 10 warmest years on record." The difference between 2011 and the warmest year in
the GISS record (2010) is 0.22 F (0.12 C). This underscores the emphasis scientists put on the long-term
trend of global temperature rise.
Because of the large natural variability of climate, scientists do not expect
temperatures to rise consistently year after year. However, they do expect a continuing temperature rise over decades.
The first 11 years of the 21st century experienced notably higher temperatures compared to the middle and late 20th century,
Hansen said. The only year from the 20th century in the top 10 warmest years on record is 1998. Higher temperatures today
are largely sustained by increased atmospheric concentrations of greenhouse gases, especially carbon dioxide. These gases
absorb infrared radiation emitted by Earth and release that energy into the atmosphere rather than allowing it to escape to space.
As their atmospheric concentration has increased, the amount of energy "trapped" by these gases has led to higher temperatures.
Press release date line - January 19, 2012 Press release
location: [
Click Here ] |
|

Explore math connections with
SpaceMath@NASA
Problem I - Modeling the Global Warming Curve - Students work with a graph of global temperatures to forecast the temperature change by 2050 using a linear extrapolation. Topics include slope, change of slope, linear extrapolation and forecasting. [Open PDF]
Problem II - The Rate of Carbon Dioxide Change in the Atmosphere - Students work with the Keeling Curve of carbon dioxide increases since 1960 and use slope and rate information to predict the atmospheric carbon dioxide abundance in 2050. Topics include interpreting slope and changes of slope. [Open PDF]
Write your own problem - Using information found in the Math Connection problems, the press release or the video program, create your own math problem that looks for patterns and trends in the global climate change data. Explain why you set the problem up this way and how you might find the answer.
Evaluate your understanding:
Challenge Problem - Scientists Track the Rising Tide Along with changes in global temperature and carbon dioxide in the atmosphere, global warming affects global sea levels through heating and expansion. The following problem introduces students to a graph of sea level rise since 1900. Students will use what they know about graph interpretation, slopes and rates of change, and perform simple forecasting for the year 2050 and beyond. [Open PDF]
Answer: The answer to this problem is provided in the PDF.

NASA / JPL
3-D Solar System
Extend your new knowledge - Use the EOSS Solar System Simulator to examine how the distance between the sun and Earth changes during the year, and how this causes a slight change in the temperature of Earth. [ Open PDF ]