|
Discovering Planets Orbiting other Stars |
||||||||
|
|||||||||
 |

Mathematics Skill or Topic Area:
Probability and Predictions
Next Gen Science Standards: PS4: Waves and Their Applications in Technologies for Information Transfer; LS1: From Molecules to Organisms: Structures and Processes; ETS 1: Engineering Design
Common Core ELA for Science: RST.6-8.2. Determine the central ideas or conclusions of a text; provide an accurate summary of the text distinct from prior knowledge or opinions; RST.6-8.8. Distinguish among facts, reasoned judgment based on research findings, and speculation in a text. RST.6-8.9. Compare and contrast the information gained from experiments, simulations, video, or multimedia sources with that gained from reading a text on the same topic.
Common Core Math Standard: CC.7.G.1 Solve problems involving scale drawings of geometric figures, including computing actual lengths from a scale drawing.

Video Engagement: Kepler Join NASA on the Kepler Mission as this traveling telescope images the light from faraway stars to locate Earth-sized and smaller planets. Using the transit method, the Kepler telescope measures the brightness of a star and uses the data to predict habitable zones (5 minutes). View Program
|
Engage your students with a press release: NASA Finds Earth-size Planet Candidates in the Habitable Zone
Is our Milky Way galaxy home to other planets the size of Earth? Are Earth-sized planets common or rare? NASA scientists seeking
answers to those questions recently revealed their discovery. "We went from zero to 68 Earth-sized planet
candidates and zero to 54 candidates in the habitable zone - a region where liquid water could exist on a planets surface.
Some candidates could even have moons with liquid water," said William Borucki of NASAs Ames Research Center, Moffett Field, Calif.,
and the Kepler Missions science principal investigator. "Five of the planetary candidates are both
near Earth-size and orbit in the habitable zone of their parent stars."
Planet candidates require follow-up observations to verify they are actual planets. "We have found over twelve
hundred candidate planets - thats more than all the people have found so far in history," said Borucki.
"Now, these are candidates, but most of them, Im convinced, will be confirmed as planets in the coming months and years."
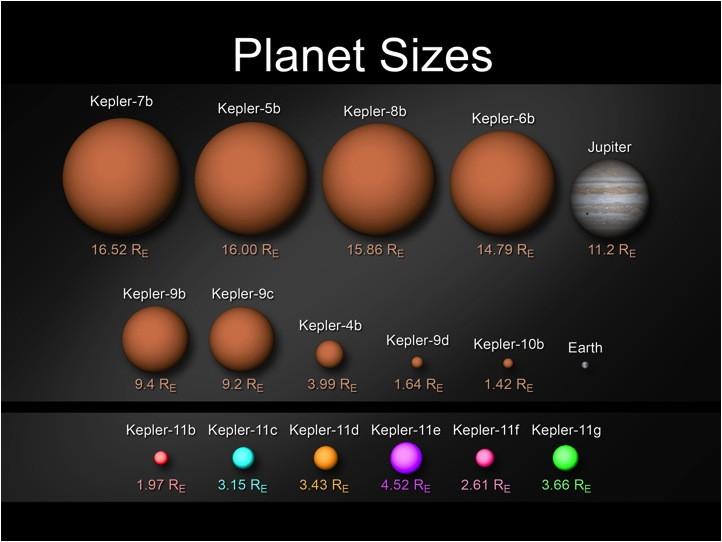
The findings increase the number of planet candidates identified by Kepler to-date to 1,235. Of these, 68 are approximately
Earth-size; 288 are super-Earth-size; 662 are Neptune-size; 165 are the size of Jupiter and 19 are larger than Jupiter.
Of the 54 new planet candidates found in the habitable zone, five are near Earth-sized. The remaining 49 habitable zone candidates
range from super-Earth size -- up to twice the size of Earth -- to larger than Jupiter.
The findings are based on the results of observations conducted May 12 to Sept. 17, 2009 of more than 156,000 stars in Keplers
field of view, which covers approximately 1/400 of the sky.
Press release date line - February 2, 2011 Press release
location: [
Click Here ] |
|
Explore math connections with
SpaceMath@NASA
Problem I - Earth-like Planets by the Score! - - Students use recent Kepler satellite data to estimate the number of Earth-like planets in the Milky Way galaxy. Topics include calculating percentage and probability, creating a histogram, and re-scaling sample sizes. [Open PDF]
Problem II - The Goldilocks Planets - Not too Hot or Cold - Students use a table of the planets discovered by the Kepler satellite, and estimate the number of planets in our Milky Way galaxy that are about the same size as Earth and located in their Habitable Zones. They estimate the average temperature of the planets, and study their tabulated properties using histograms. Topics include averaging, probability and creating histograms. [Open PDF]
Explain your thinking:
Write your own problem - Using information found in the Math Connection problems, the press release or the video program, create your own math problem that involves determing probabilities from the data. Explain why you set the problem up this way, and how you might find its answer.
Evaluate your understanding:
Challenge Problem - Suppose that planets are distributed around their stars so that the number of planets is proportional to the surface area of the circular disk centered on the star. If the radius of the disk is 1 billion kilometers, at what radius will 50% of the planets be inside this distance and 50% outside? Explain how you arrived at this answer.
Answer: The total area of the disk is just the area of a circle with a radius of 1 billion kilometers. We want to find the radius for which the area is exactly 1/2 the total area. This will occur for a radius of 700 million kilometers.

NASA / JPL
3-D Solar System
Extend your new knowledge - Use the Eyes on the Solar System simulator to study how planets and their moons are distributed in our solar system, as a clue to how planets orbiting other stars might be distributed. [ Open PDF ]