|
Space Weather and Solar Storms |
||||||||
|
|||||||||
 |

Mathematics Skill or Topic Area:
Data Collection and Analysis
Next Gen Science Framework: PS1: Matter and Its Interactions, PS1.A: Structure and Properties of Matter, PS3.C: Relationship Between Energy and Forces, ETS1.A: Defining and Delimiting an Engineering Problem, ETS2.B: Influence of Engineering, Technology, and Science on Society and the Natural World, ESS1.B: Earth and the Solar System
Common Core ELA for Science: RST.6-8.2. Determine the central ideas or conclusions of a text; provide an accurate summary of the text distinct from prior knowledge or opinions. RST.6-8.8. Distinguish among facts, reasoned judgment based on research findings, and speculation in a text. RST.6-8.9. Compare and contrast the information gained from experiments, simulations, video, or multimedia sources with that gained from reading a text on the same topic.
Common Core Math Standard: 6.SP.3 Recognize that a measure of center for a numerical data set summarizes all of its values with a single number, while a measure of variation describes how its values vary with a single number; 6.SP.4 Display numerical data in plots on a number line, including dot plots, histograms, and box plots; 6.SP.5.c Giving quantitative measures of center (median and/or mean) and variability (interquartile range and/or mean absolute deviation), as well as describing any overall pattern and any striking deviations from the overall pattern with reference to the context in which the data were gathered.

Video Engagement: Space Weather This NASA eClips video segment looks at space weather and examines the major impacts that space weather can have on Earth (5 minutes). View Program
|
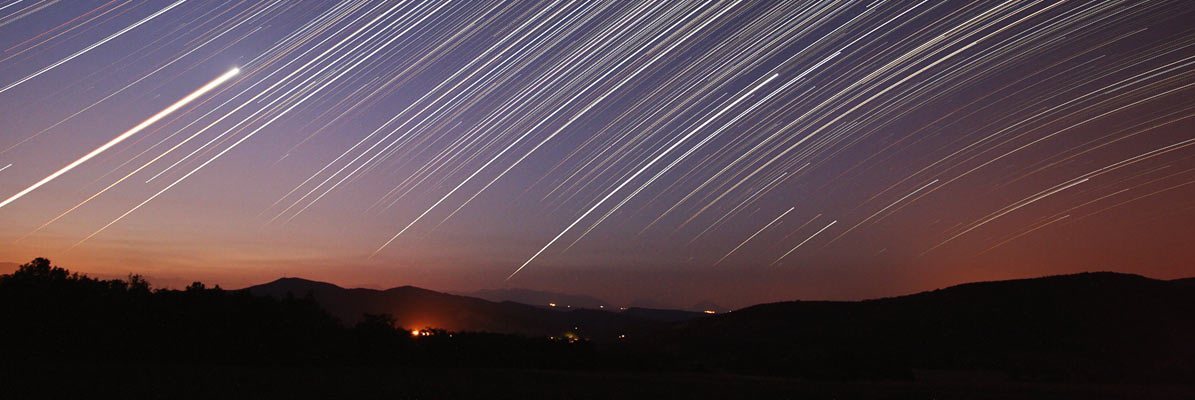
Engage your students with a press release: A Taste of Solar Maximum
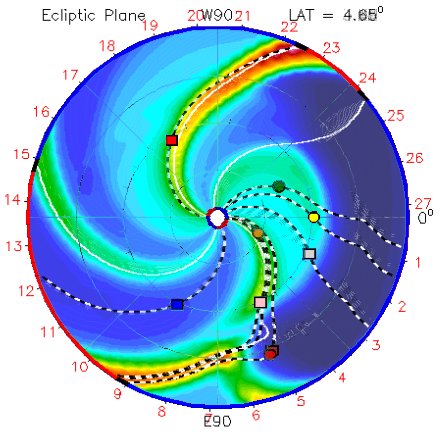
Forecasters use mathematical models to predict the future. The image above shows one kind of model.
This one predicts how clouds of gas travel across the solar system to Earth. Every 11 years, sunspots increase
and decrease in their numbers. Sunspot Maximum, a time when sunspot numbers are at their highest, is due in the
year 2013. When it arrives, the sun will produce more solar flares, and more auroras than we have experienced in
quite some time.
When the sun is very active, clouds of gas called coronal mass ejections, explode away from the sun's surface. Scientists call
these billion-ton clouds CMEs for short. When they arrive at Earth they produce dazzeling aurora. They can also cause problems for the
satellites and electrical systems we rely upon.
On July 12, 2012, a powerful solar flare hurled a massive CME toward our planet at nearly 2 million miles per hour. This triggered
the most spectacular display of auroras seen in many years. For more than 36 hours, brilliant aurora circled Earth's poles.
Northern Lights were seen as far south as Arkansas. Southern skies turned red over New Zealand.
The source of the CME was a giant sunspot called AR1520; a seething nest of tangled magnetism more than 15 times wider than Earth itself.
In space, NASA's STEREO spacecraft and the Solar and Heliospheric Observatory monitored the CME. Scientists at NASA used this satellite data to predict when the cloud would arrive. It took almost
two full days for the CME to reach Earth. The CMEs impact caused Earth's magnetic field to shake violently. This impact caused electrical currents to flow through the soil. Over 100 years ago, telegraph systems would routinely be damaged by these currents. Fortunately, the strike did no harm. Expensive satellites
survived, and electrical power grids stayed online.
Next came the light show. As the CME's wake washed across Earth, the polar regions of our planet lit up like a Christmas
tree. Red, green, blue and purple auroras capped both poles of the planet.
From one end of the planet to the other, spanning more than 90 degrees of combined north-south latitude, 183 degrees of
temperature, and 360 degrees of longitude, this was truly a world-wide space weather event...And it was just a taste of things to come.
Press release date line - July 23, 2012 Press release
location: [
Click Here ] |
|
Explore
math connections with SpaceMath@NASA
Problem I -
Investigating Solar Storm Magnetism -
When a solar storm travels through space it carries part of the Sun's magnetic field with
it. The Advanced Composition Explorer (ACE) satellite measures the strength of this field and its polarity (North or
South). In this problem students investigate ACE data to determine its basic properties.
[Open PDF]
Problem II -
Exploring Sunspots and Solar Storms -
Sunspots are a sign that the Sun is in a stormy state. Sometimes these storms can affect Earth and cause all
kinds of problems such as satellite damage and electrical power outages. They can even harm astronauts working in space. Scientists use many different
types of measurements to track this stormy activity. In this exercise students will learn how to analyze some of this data.
[Open PDF]
Explain
your thinking: Write
your own problem - Using information
found in the Math Connection problems, the press release or the video
program, create your own math problem. Explain why you set the problem up this
way, and how you might find its answer.
Evaluate
your understanding: Challenge Problem
-
Magnetic observatories generate a huge amount of data far too much for anyone to understand easily. To help scientists take a
quick measure of Earths magnetic storminess, they invented the Planetary Variability index: Kp. Scientists measure how much the magnetic field changes
at 13 observatories around the world, and then average these measurements together.
In the attached problem, Interpreting Bar Graphs, students will study and analyze the bar graph
data for the magnetic index recorded between November 19 and 22, 2003 and see if they can answer the three questions.
[Open PDF]

NASA / JPL
3-D Solar System
Extend your new knowledge - Visit the NASA Space Weather simulator and explore solar storm travel times. [ Open PDF ]